CAL FIRE - Wildfire Hazard & Risk Modeling (2020-2035)
Mapping California’s Wildfire Future
Statewide hazard and risk modeling to guide the next decade of fire management
In our recent story, The Cost of Delay, we showed that wildfire risk mitigation works—and that the cost of inaction far exceeds the cost of prevention. But knowing that action matters is only the first step. Land managers, agencies, and communities also need to know where to act, when conditions will be most dangerous, and how wildfire risk is likely to change over time. That is the role of a qualitative wildfire risk assessment.
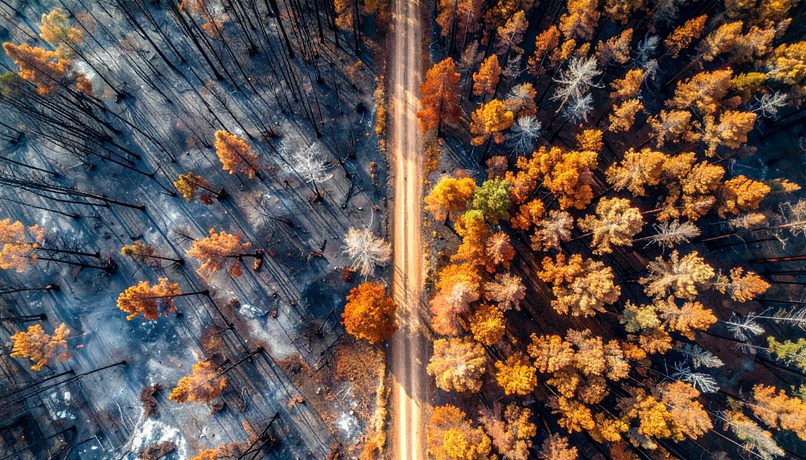
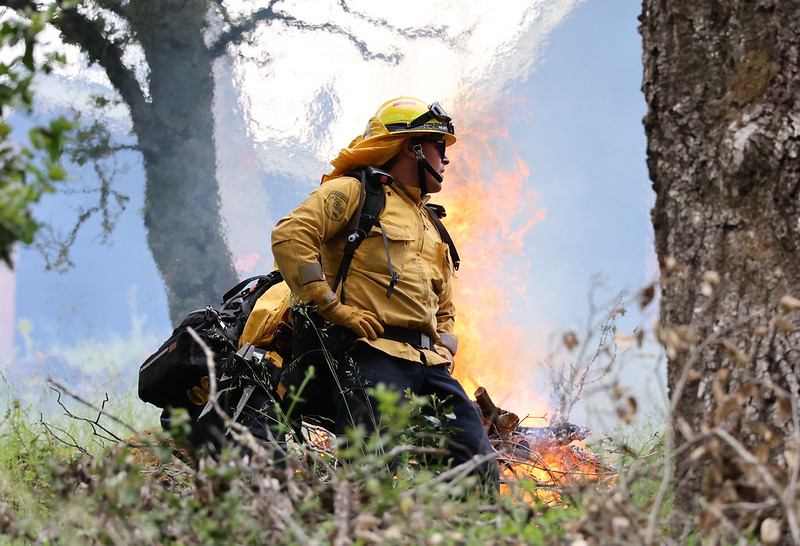
Photo © CAL FIRE.
New work funded through the CAL FIRE Forest Health Research Program—Modeling Current and Future Wildfire Hazard and Risk in California Under Alternative Fuel Scenarios—provides a comprehensive, statewide view of wildfire hazard and risk from 2020 through 2035, evaluated under multiple fuel conditions. The resulting data is now publicly available.
An important caveat: this dataset is not a vulnerability score or a predictive model. It does not account for building materials, defensible space, or parcel-level conditions. It is an exposure layer—a transparent, open-source way to quantify how community form and building density create pathways for fire spread, complementing rather than replacing structure-level vulnerability assessments.
What is a Quantitative Wildfire Risk Assessment?
Wildfire risk is not just about whether a fire might occur. It is about what happens when it does, and what that means for the people, communities, and resources on the landscape.
Understanding this requires more than a single metric or map; it requires a systematic analytical approach. A quantitative wildfire risk assessment (QWRA) is a structured, data-driven framework1 for evaluating how wildfire may affect a specific landscape by analyzing both fire behavior and what is exposed to it.
Wildfire operations near community infrastructure in California. Photo © CAL FIRE.
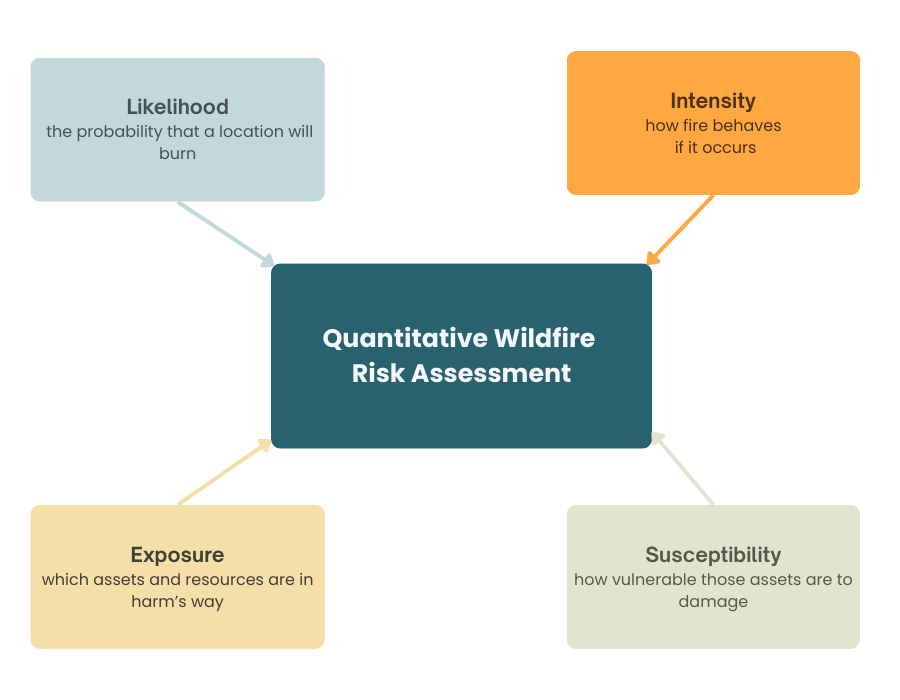
Conceptual framework for quantitative wildfire risk assessment. Graphic by Vibrant Planet Data Commons.
To do this, a risk assessment brings together four interrelated components:
- Likelihood – the probability that a location will burn
- Intensity – how fire behaves if it occurs
- Exposure – which assets and resources are in harm’s way
- Susceptibility – how vulnerable those assets are to damage
Together, these components allow risk to be evaluated in a way that reflects not just where fire is possible, but where it matters most.
At the core of this framework is wildfire hazard, which describes the biophysical and climatic conditions that influence fire behavior across the landscape. In the quantitative framework for assessing wildfire risk to highly valued resources and assets¹, hazard is defined by two factors: burn probability (likelihood of burning) and fire intensity (commonly measured using flame length, fireline intensity, or related metrics). These factors describe how often fire is expected to occur and how intense it is likely to burn.
Exposure and susceptibility, by contrast, describe vulnerability—what lies in the path of fire and how sensitive those assets are to its effects. When hazard and vulnerability are considered together, they provide a quantitative measure of wildfire risk.
In short, wildfire risk reflects the combined outcome of hazard (likelihood × intensity) and vulnerability (exposure × susceptibility).
Capturing all four components consistently and at scale requires advanced modeling tools capable of representing both where fire is likely to occur and how it is likely to behave once it does.
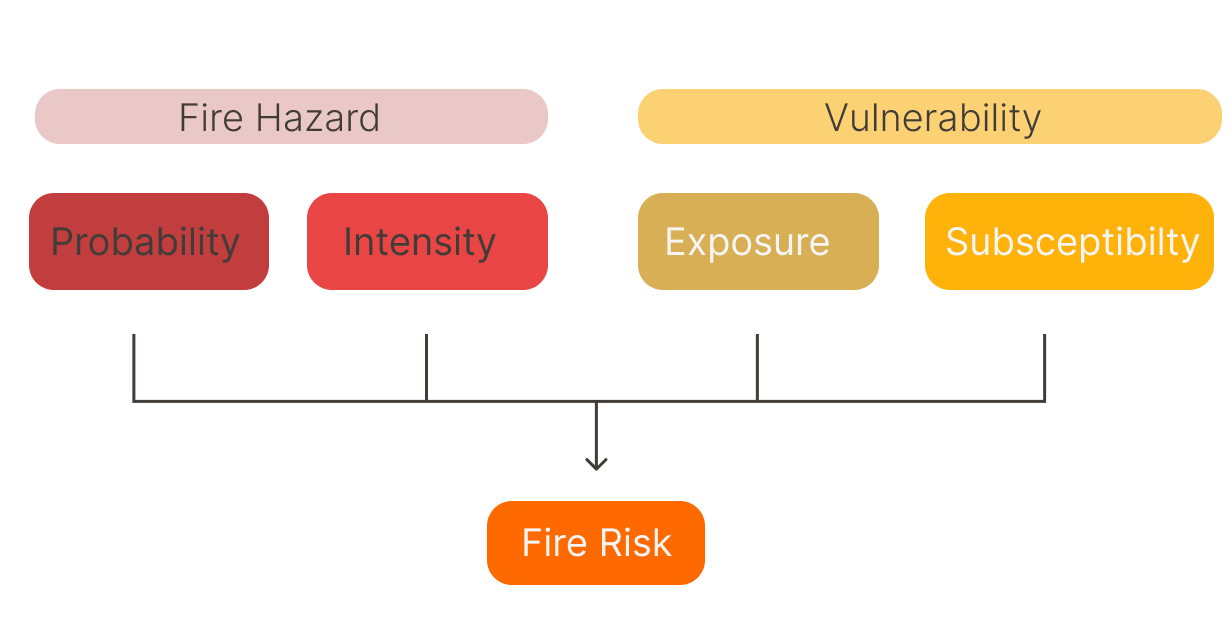
Conceptual framework for quantitative wildfire risk assessment, illustrating how wildfire hazard (likelihood and intensity) and vulnerability (exposure and susceptibility) combine to determine fire risk. Graphic adapted from Pyrologix
Two models, one picture of risk
Characterizing wildfire risk at a statewide scale requires understanding both where fire is likely to occur and how it is likely to behave once it does. No single model can fully represent both dimensions
For this reason, the assessment integrates two complementary modeling systems: FSim and WildEST. Each addresses a distinct component of wildfire hazard, and together they provide a more complete and operational picture of risk.
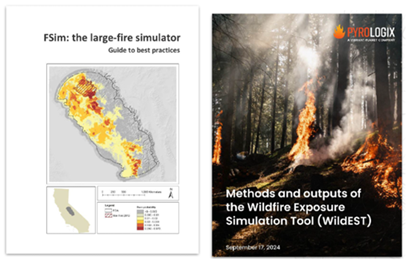
FSim2 focuses on likelihood, estimating burn probability by simulating thousands of potential fire seasons based on historical fire occurrence, weather, and fuel conditions. While WildEST3 focuses on behavior, modeling fire intensity, flame characteristics, and ember dynamics—factors that strongly influence damage to communities and infrastructure.
Together, these models allow analysts to evaluate not just whether fire is likely to reach a location, but how it is likely to behave once it does.
A temporal framework for wildfire risk
This dataset is designed to support analysis of how wildfire hazard and exposure change over time, rather than representing a single snapshot in time or a single set of burning conditions. The scenario structure is a core part of how the data works, allowing users to compare wildfire risk under different fuel conditions and planning horizons, including both near-term conditions and a long-term climax reference.
The project includes five statewide scenarios representing conditions modeled for 2020, 2025, and 2035, including a treated 2025 case that illustrates how additional fuel treatments can alter hazard patterns:
- 2020-capable – baseline conditions built from 2010–2019 fuels data
- 2025-capable – near-term projection incorporating recent disturbance
- 2025-capable with treatment – showing the effect of additional fuel treatments
- 2035-capable – longer-term hazard trajectory
- Climax – a long-term scenario representing near-worst conditions for each vegetation type
Each scenario is described as “capable,” referring to the year of fire behavior being modeled. In practice, each fuelscape is compiled from fuels and disturbance data from the preceding decade and then used to simulate likely fire behavior for the target year.
The long-term climax scenario does not represent a prediction. Instead, it characterizes near-worst fuel conditions for each vegetation type and biophysical setting and functions as a stress test for understanding how hazard and exposure could evolve if fuels continue to accumulate over time.
How this data is used
This body of work provides more than final risk layers. It delivers the underlying fuels, fire occurrence, and fire behavior data needed to support wildfire planning and decision-making across California.
To manage wildfires, it is vital that accurate, high-resolution wildfire hazard data are available—to the greatest degree possible—to inform fire management strategies. These outputs can be used to support the planning, prioritization, and implementation of prevention and mitigation activities such as prescribed fire and mechanical fuel treatments. In addition, hazard data can support fire operations by informing decisions about the allocation and positioning of firefighting resources.
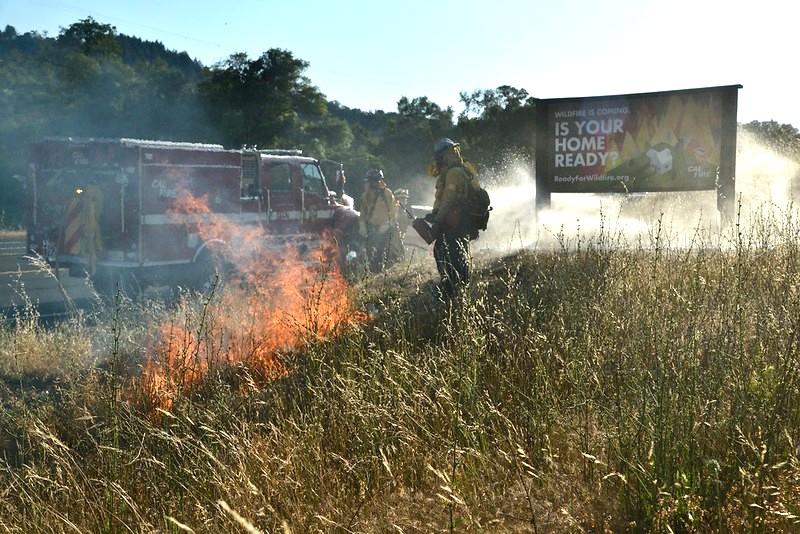
Photo © CAL FIRE.
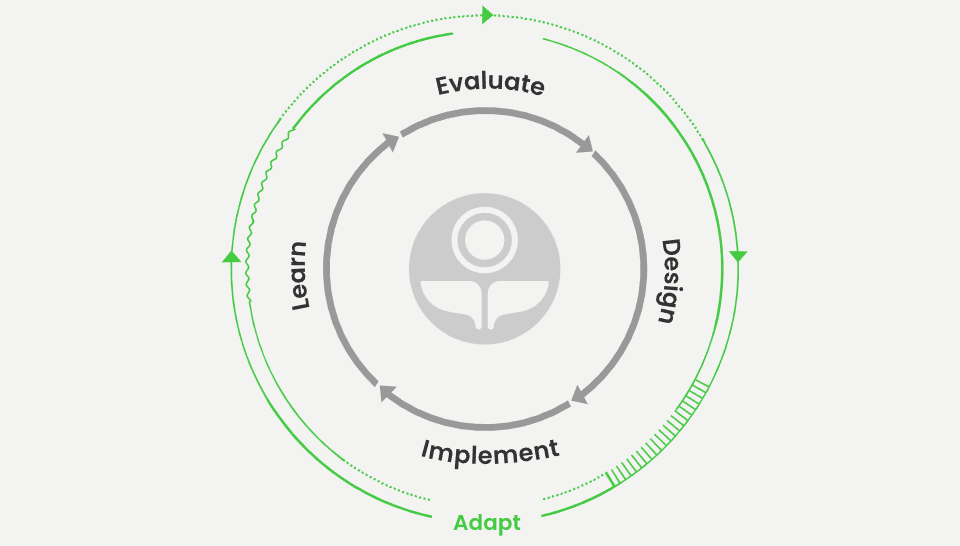
Adaptive wildfire planning and decision-support cycle, illustrating how evaluation, design, implementation, and learning inform iterative management. Graphic by Vibrant Planet.
Recent advancements in wildland fire decision-support tools have increasingly emphasized the use of high-resolution wildfire hazard data to enhance planning and management strategies. Sophisticated platforms, such as the Vibrant Planet Platform, are designed to integrate with treatment prioritization systems like ForSys, enabling more detailed assessments and plans for mitigating wildfire risk. By harnessing high-resolution data, these tools can support community wildfire planning, guide mitigation strategies, and facilitate the development of NEPA (National Environmental Policy Act) projects. This integration improves the precision of fire management decisions while supporting community resilience and reducing environmental impacts.
Are you interested in exploring or applying this dataset in your work?
We want to hear from you!
Vibrant Planet and Vibrant Planet Data Commons are actively tracking how their datasets are used to support impactful wildfire management and research. Contact us to share your ideas, feedback, or success stories, and help us make data-driven solutions a reality.
Why risk assessments matter in California
Forest and fire management practices over the past century have altered natural fire regimes, leaving large areas of wildlands in the western United States susceptible to high-severity wildfire events⁴. Frequent, large-scale disturbances threaten both life and property. The scale and frequency of these disturbances are also projected to increase under a warming climate⁵⁻⁷, further jeopardizing forest sustainability and associated ecosystem services. California, in particular, has experienced several devastating wildfire events in recent years, including the August Complex, Caldor, Camp, Dixie, Park, Eaton, and Palisades fires, resulting in significant loss of life and property.
In response, public land managers in California and elsewhere have initiated accelerated restoration and risk reduction programs to improve forest resilience and reduce risks to Highly Valued Resources and Assets (HVRAs). Forest management activities include thinning, mastication and removal of surface fuels, broadcast burning, and other treatments⁸. Implementing these programs requires identifying priority landscapes to ensure efficient use of limited financial resources. Prioritization is complex, given the multi-use mandate of public lands and the need to balance socioeconomic and ecological objectives⁹.
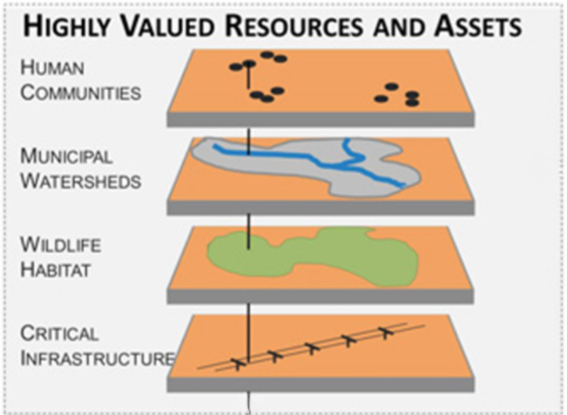
Illustration of Highly Valued Resources and Assets (HVRAs) commonly considered in wildfire risk assessment and treatment prioritization. Graphic from USFS report GTR-315.
To ensure that investments in forest restoration and risk reduction align with landscape and societal needs, fine-scale quantitative data are essential. Data analytics can support all stages of fuel reduction program analysis, including the ability to:
- Prioritize fuel treatments where they reduce community exposure most
- Evaluate tradeoffs among competing objectives
- Estimate treatment effectiveness before implementation
- Track return on investment over time
This data is designed to support CAL FIRE and its partners, as well as Tribes, federal agencies, local jurisdictions, NGOs, researchers, and planning platforms working toward a more fire-adapted California.
IMPORTANT NOTE: This dataset does not include home construction characteristics, defensible space, or parcel-level vulnerability. It is an exposure layer that describes potential structure-to-structure pathways. It should be used alongside, not instead of, detailed vulnerability assessments.
What’s in the data
The dataset includes both final risk outputs and the underlying components needed for independent analysis, including:
- Fuelscapes (30m rasters)
- FSim
- Burn probabilities (30m rasters)
- Modeled fire ignitions (vector points)
- Modeled fire perimeters (vector polygons)
- WildEST fire behavior (30m rasters)
- Flame-front characteristics (ex: intensity, spread rate)
- Probabilities for various types of fire (ex: surface, passive crown)
- Likelihoods of exceeding operational controls (ex: manual, mechanical)
- Probabilities for flame lengths (ex: probability of 2-4’ flames)
- Ember characteristics (ex: ember production, load)
- Wildfire risk to homes (ex: structure exposure score (SES), sources of embers for buildings)
- HVRA-linked wildfire risk layers related to communities, infrastructure, surface drinking water, and timber
All data is provided in NAD83 / CONUS Albers (EPSG:5070) and spans California and adjacent portions of northwestern Nevada.

What’s next
This story introduces the data and the modeling framework behind it, offering a starting point for understanding wildfire hazard and risk across California. A more detailed companion piece will follow in 2026, exploring modeling methods, scenario results, and applied use cases in greater depth.
For now, the data is ready. If you are working to understand or reduce wildfire risk in California, this dataset provides a shared, quantitative foundation for action.

Photo © CAL FIRE.
Explore the Data Behind the Story
Take a deeper dive into the patterns and trends shaping wildfire behavior across the U.S. Access the full datasets to analyze fire frequency, severity, and historical shifts in fire activity. Whether you're a researcher, land manager, or policymaker, this data provides the foundation for informed decision-making and action.
References
1. Scott J, Thompson M, Calkin D. “A Wildfire Risk Assessment Framework for Land and Resource Management”. Gen. Tech. Rep. RMRS-GTR-315. U.S. Department of Agriculture, Forest Service, Rocky Mountain Research Station, Fort Collins, CO. 2013. Available at: https://www.fs.usda.gov/rm/pubs/rmrs_gtr315.pdf
2. Scott JH, Short KC, Finney MA. “FSim: The Large-Fire Simulator Guide to Best Practices.” Pyrologix. 2018; Available at: https://pyrologix.com/wp-content/uploads/2019/11/FSimBestPractices_0.3.1.pdf
3. Scott JH, Moran CJ, Callahan MN, Brough AM, Thompson MP. “Methods and Outputs of the Wildfire Exposure Simulation Tool (WildEST).” Pyrologix. 2024. Available at: https://www.pyrologix.com/reports/WildEST%20Documentation.pdf
4. Hessburg PF, Agee JK, Franklin JF. “Dry Forests and Wildland Fires of the Inland Northwest USA: Contrasting the Landscape Ecology of the Pre-Settlement and Modern Eras.” Forest Ecology and Management. 2005; 211:117-139
5. Westerling AL, Hidalgo HG, Cayan DR, Swetnam TW. “Warming and Earlier Spring Increase Western Us Forest Wildfire Activity.” Science. 2006;313:940-943
6. Bentz BJ, Regniere J, Fettig CJ, Hansen EM, Hayes, JL, Hicke JA, Kelsey RG, Negron JF, Seybold SJ. “Climate Change and Bark Beetles of the Western United States and Canada: Direct and Indirect Effects.” Bioscience.2010;60:602-613
7.Hansen AJ, Neilson RP, Dale VH, Flather CH, Iverson LR, Currie DJ, Shafer S, Cook R, Bartlein PJ. “Global Change in Forests: Responses of Species, Communities, and Biomes: Interactions between Climate Change and Land Use Are Projected to Cause Large Shifts in Biodiversity.” Bioscience. 2001;51:765-779
8. Agee JK, Skinner CN. “Basic Principles of Forest Fuel Reduction Treatments.” Forest Ecology and Management. 2005;211:83-96
9. Maron M, Cockfield G. “Managing Trade-Offs in Landscape Restoration and Revegetation Projects.” Ecological Applications. 2008;18:2041-2049