The Cost of Delay
Why Investment in Strategic Wildfire Risk Mitigation Can't Wait
THE WILDFIRE CRISIS
The rise in catastrophic wildfire affects every American.
Since 2020, wildfires have claimed at least 200 lives, destroyed more than 100,000 homes and structures, and cost the U.S. hundreds of billions of dollars1.
Explore three decades of U.S. wildfire data (1990-2025). Use the time slider to see patterns by year. Click fire markers for details. Featured fires highlight key trends in wildfire behavior and impact. Source: Vibrant Planet Data Commons using Monitoring Trends in Burn Severity (MTBS)2 and National Interagency Fire Center (NIFC)1 data for 2025. The map shows only incidents with reported acreage. YTD 2025: 1,156,100 acres burned.
CATASTROPHIC WILDFIRES ARE ACCELERATING
Today’s fires burn hotter, move faster, and cause more destruction than ever before2
Large, fast-spreading fires have nearly tripled in the past two decades, and high-severity burns are surging, especially across the West3,7.
Wildfires cost the U.S. economy an estimated $394–893 billion annually8
Lost income, health, and economic impacts, as well as infrastructure damage and ecosystem loss, add to the cost.
Wildfire is now a national issue.
Toxic wildfire smoke travels from coast to coast, while the economic impacts threaten to collapse insurance and mortgage markets9, impact recreation-based economies10, and disrupt supply chains nationwide11.
But solutions exist...
Risk mitigation works
While wildfire intensity is rising, proven solutions already exist. Landscape-scale fuel treatments—like strategic thinning and prescribed fire—combined with community-level measures like defensible space and home hardening—form the foundation of effective wildfire resilience.
With wildfire, the adage holds true: “An ounce of prevention is worth a pound of cure”. Modern fire modeling shows how targeted interventions can reduce fire intensity, slow spread, and make communities more defensible even under extreme conditions.
Any community in the country can mitigate its wildfire risk. The following analysis highlights seven high-risk communities where a modest investment in risk mitigation could deliver substantial protection when fire strikes while enhancing water quality, recreation sites, biodiversity, and other local values.
These estimates show how much proactive treatments could reduce wildfire damage if a fire were to occur. “Avoid” refers to the projected dollar value of conditional losses prevented under modeled fire scenarios. “Reduction” indicates the percentage of damage that would be avoided. For example, a 60% reduction means treatments could cut destruction by more than half.[See Methods for more.]

McCall, ID
Protecting water quality and the recreation-based economy
McCall's identity centers on Payette Lake and the surrounding forests, which draw visitors year-round. Proactive treatments protect not just structures but also water quality and outdoor access, which sustain the local economy, from lakefront properties to recreation-focused businesses.
Big Sky, MT
Mitigating risk to high value real-estate and a tourism-based economy
In Big Sky wildfire poses an imminent threat to the local tourism-driven economy and high value real estate market. The ski resort, and summer recreation economy depend upon the pristine landscapes that strategic fire management can preserve while increasing job growth and property values.
Cedar City, UT
Ensuring a rural economic hub continues to thrive
Cedar City demonstrates that strategic risk mitigation investment works at any scale. For rural communities, wildfire treatments deliver dual benefits—economic development through sustainably harvested timber revenue and recreation enhancements, while protecting homes and local businesses that form the backbone of the regional economy.
Elko, NV
Safeguarding Nevada's mining capital and rural economy
Elko, a vital center for gold mining and ranching in northeastern Nevada, faces increasing wildfire threats due to its vast grasslands and proximity to federal lands. Recognizing this risk, the Sierra and Elko Fronts Wildfire Crisis Landscape Project has allocated $53 million to enhance forest resilience and safeguard critical infrastructure in the region. These investments aim to protect Elko's economic backbone and ensure the safety of its communities against escalating wildfire dangers.
Boulder, CO
Reducing threats to metropolitan areas in the west
The Marshall Fire in 2021 was the most destructive wildfire in Colorado’s history, burning 1084 homes at a total value of $513,212,589. The Colorado Front Range continues to face wildfire threats across a vast wild-urban interface, home to multiple universities, Boulder’s tech corridor, research facilities, and a major recreation-based economy. Strategically placed treatments can mitigate risk in the highest fire probability areas of Boulder.
Alamogordo, NM
Protecting a tourism gateway and military community
Alamogordo anchors a unique economy built around tourism, military operations, timber, and outdoor recreation. The city's proximity to military installations and unique desert ecosystems underscores the importance of proactive wildfire mitigation. Efforts are underway to bolster Alamogordo's wildfire defenses, aiming to protect both its residents and the surrounding natural landscapes from future fire events.
Flagstaff, AZ
Protecting regional infrastructure and boosting livelihoods
Flagstaff anchors the economy in Northern Arizona. It’s home to Northern Arizona University, major transportation corridors, and a regional timber focused economy. The city demonstrates how strategic, ecological forest treatments can grow sawmill and forestry investments while reducing wildfire threat to timber, thousands of homes, and the infrastructure and institutions that serve hundreds of thousands across the Colorado Plateau region of Arizona.
These seven communities are diverse in size, geography, and structure—but the result is the same:
Strategic investments prevent catastrophic losses.
(Scroll down to see how $138.9M can prevent over $1B in losses.)
The colored areas on the map represent priority treatment zones identified through Vibrant Planet's modeling platform. These areas were selected using advanced wildfire behavior modeling and spatial optimization tools to maximize risk reduction and community protection. They reflect potential treatments that could deliver the greatest impact under modeled fire scenarios.
Through a combined $138.9 million in targeted wildfire resilience treatments, these communities stand to avoid an estimated $1.01 billion in wildfire-related structure losses if wildfire strikes.This highlights the significant protective benefits that proactive investments can provide across diverse landscapes.

Avoided losses and treatment investments were simulated using advanced fire behavior modeling under the full range of historical weather conditions. The analysis assumes conservative rebuild cost estimates and models expected protection benefits from strategic wildfire mitigation treatments in seven high-risk U.S. communities. Learn more about the analysis methods HERE.
Could risk mitigation efforts have reduced the impact of the Eaton fire in Altadena?
Strategic fuel treatments might have slowed the fire’s advance, giving firefighters more time to save lives and property.
On January 7, 2025, the Eaton Fire swept through the Los Angeles community of Altadena, claiming nineteen lives, destroying more than 9,400 structures and damaging 1,000 more. Total estimated losses range from $24 to $45 billion14.
This immersive animation by Navteca, developed with support from NASA and featured in the PBS documentary Weathered, visualizes the Eaton Fire’s rapid advance from the Wildland-Urban Interface into the community of Altadena. Retrofitting buildings to today's fire codes and improving defensible space, in addition to wild-urban interface mitigations, would have had an even more profound protective effect.
Post-fire analysis from Vibrant Planet shows that a targeted $9 million investment in fuel reduction and strategic fire breaks in high-priority zones in the wild-urban interface along the foothills of Altadena could have significantly reduced fire intensity, slowed its spread, and decreased ember transport from wildlands into the community. These treatments would have given firefighters critical time to evacuate residents and defend the community.

Wildfire-fueled cascading disasters: After major fires, heavy rains can trigger flash floods, debris flows, and slope failures—causing widespread damage long after flames are out. These cascading risks increasingly threaten communities nationwide, from California to the Southeast. Source: White River National Forest U.S. Forest Service
Compounding Disasters
Catastrophic wildfires are becoming more frequent and often lead to a series of additional hazards. The damage caused by the initial fire alters the landscape, which increases the risk of flash floods, debris flows, and infrastructure failures. These secondary impacts can compound the effects of the fire for months or even years after the flames have been extinguished. After the Glenwood Canyon fire in Colorado, a massive landslide shut down I-70 for two weeks, disrupting an estimated $336 million in economic throughput, based on an average loss of $1 million per hour of closure15.
These cascading hazards are playing out across the country. In Tennessee and North Carolina, the 2016 Great Smoky Mountains fires were followed by intense rains that caused additional flooding and damage. Across the Southeast, the combination of wildfire, steep terrain, and post-storm rains creates growing compound disaster risks as hurricanes track across fire-impacted landscapes.
Sustained Federal and State Funding for Wildfire Risk Mitigation is Crucial, Now
This analysis demonstrates the substantial return on investment that strategically prioritized wildfire risk mitigation can deliver across communities and the wildland-urban interface. However, despite rapidly escalating wildfire threats, federal and state agencies have historically allocated less than 10% of their fire budgets to proactive mitigation16. Too often, prevention dollars are redirected to emergency response as wildfire seasons intensify and suppression costs surge — now nearly 70% higher than they were just four decades ago, even when adjusting for inflation1.
Strategic and sustained wildfire investment in America's highest-risk communities and landscapes is essential to protecting lives, property, and keeping insurance accessible and affordable. It's also crucial for safeguarding our water, biodiversity, timber, local economies, and outdoor recreation.
In this story, we focus on wildfire risk, not just hazard. Hazard refers to the potential for fire to occur and how it might behave—based on factors like fuel load, vegetation, topography, and drought. Risk goes further. It combines hazard with what’s exposed—homes, infrastructure, ecosystems—and how vulnerable those things are. Risk is where prevention and investment can change outcomes.
Strategic Treatments + Structure Hardening = Maximum Impact
Wildfire resilience is strongest when it combines landscape and structure-level strategies. Forest treatments like thinning and prescribed fire can reduce fire intensity across large areas, especially when applied together. In Oregon's 2021 Bootleg Fire, areas treated with both experienced far less damage than untreated zones or those with thinning alone—68% of thin-only areas burned at high severity13. The Black Hills Project, led by the Klamath Tribes and partners, shows how these treatments supply material for innovative wood products while restoring fire-adapted landscapes.

Bootleg Fire, Oregon (2021): Areas treated with both thinning and prescribed fire saw significantly less damage. Photo: Steve Rondeau, Klamath Tribes Natural Resources Director.
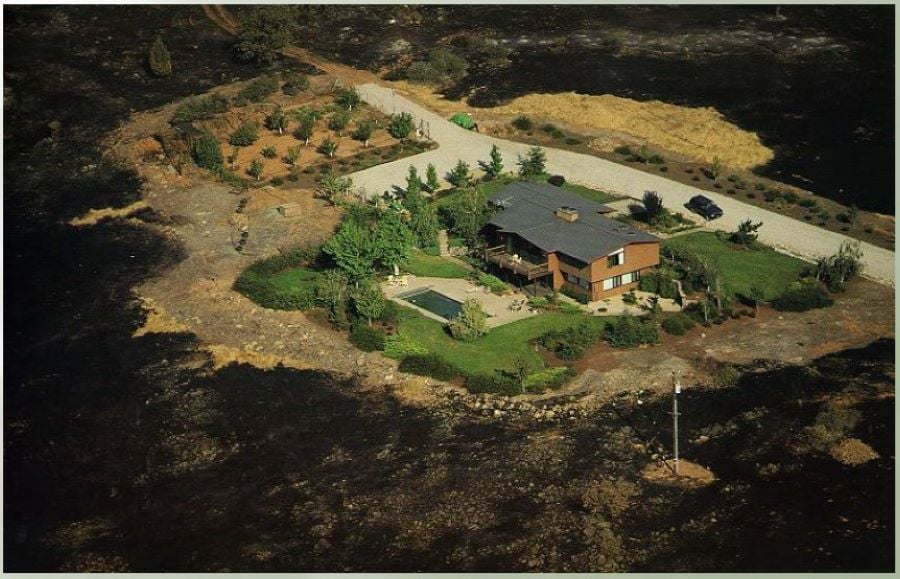
Defensible space in action: This home survived because vegetation and debris were cleared around the property, creating a protective buffer against flames. This community-level defense works best when paired with broader landscape fuel treatments. Photo: Santa Barbara County Fire Department
With an increasing number of people living in the wild-urban interface, landscape scale treatments must be combined with neighborhood and home level hardening to make structures less vulnerable to wildfire. Updating roofing and siding materials, improving defensible space, and other measures can build neighborhood-level "herd immunity" to wildfire, ensuring human structures don't add fuel to the fire.
Targeting Investments Where They're Needed Most
Thousands of communities across the country face similar wildfire risk17, and all of them can take action. The animation below illustrates these compounding risks. First, it shows where more than 1 million existing structures are already exposed to extreme wildfire risk. Then, it shifts to a landscape-scale model estimating where homes would face the highest threat if built today. The takeaway is clear: billions of dollars in homes, businesses, and infrastructure are already vulnerable, and without sustained investment, we risk repeating that same pattern.

Source: Wildfire Risk to Communities. 2022. Community Wildfire Risk Data. U.S. Department of Agriculture, Forest Service, Washington Office. Available at: https://wildfirerisk.org/download. Mapping: Vibrant Planet Data Commons
More than 1 million structures face extreme wildfire exposure, representing up to $600 billion in direct property risk17,18.
The pyrocene age
Understanding this crisis requires looking beyond budget shortfalls and suppression costs to the deeper, systemic shifts driving increasingly catastrophic—and costly—wildfire impacts. We have entered the Pyrocene , an age defined by fire, much like ice once defined the Ice Age. But unlike past epochs shaped by natural forces, the Pyrocene is fundamentally human-driven 19,20.

Burn Probability: 1990–2030: This animation shows how wildfire burn probability has shifted and may change over time. Modeled by Pyrologix using advanced fire behavior simulations (FSim, WildEST). Data: Pyrologix; USDA Forest Service RDS-2020-0016-2.
Yet fire itself isn't the enemy. Nearly half of Earth's ecosystems have evolved with and depend on regular fire cycles21. For millennia, natural fire cycles helped renew ecosystems and sustain healthy landscapes. But today's catastrophic wildfires burn with such extreme intensity that they sterilize soils, destroy forests, and level entire communities – while erasing decades of investment in minutes and generating economic losses that far exceed historical precedent22-26.
Today’s catastrophic fires are destructive due to a set of compounding human and environmental factors27:
Legacy of fire suppression
Well-intentioned policies designed to protect communities allowed hazardous fuel loads to accumulate far beyond historical norms.
Inconsistent forest management approaches
Decades of shifting between intensive harvesting and hands-off management created unnaturally dense forests, fueling intense fires.
Loss of traditional fire management practices
For millenia, indigenous stewardship maintained healthy landscapes through regular, controlled burning – practices often not allowed today.
Expanded wildland-urban interface
Rapid population growth pushes development deeper into fire-adapted landscapes, increasing ignition sources and complicating suppression efforts.
Development patterns that increase vulnerability
Land-use decisions and construction practices often fail to adequately account for wildfire risk, amplifying community vulnerability.
Drought and extreme weather patterns
Extended dry periods and higher temperatures have turned vast areas into tinderboxes, primed to ignite at the smallest spark.


These interconnected factors have fundamentally reshaped the geography of wildfire risk across the country. While each factor independently increases danger, their convergence is most visible—and most consequential—in the explosive growth of the wildland-urban interface (WUI), where homes and flammable landscapes collide.
The WUI now encompasses more than 44 million homes across 60,000 communities nationwide, expanding by 2 million acres annually28-30. Between 1990 and 2020, the WUI grew by 47% in the number of homes and 31% in total area, now covering 9.4% of the U.S. land area29,31.
Wildland-Urban Interface (WUI) Growth Across the U.S. This interactive map shows where homes meet flammable landscapes. Click bookmarks to explore featured communities or pan and zoom to examine any region in detail. Source: SILVIS Lab, University of Wisconsin–Madison, 2022. silvis.forest.wisc.edu/data/wui-change
- NASF, Wildland Fire
Understanding where wildfire risk is concentrated is crucial for targeting investments effectively. Just as we invest in flood control for floodplains and earthquake preparedness in seismic zones, we need sustained, strategic investment in wildfire mitigation where the stakes are highest. But the window for proactive action is narrowing.
Each year we continue reacting instead of preventing, the stakes grow, and the losses multiply.
The choice is clear: keep spending billions on recovery, or invest in prevention that delivers economic returns now and resilience for the future. Communities that act early won’t just be safer—they’ll be stronger.
- Vicki Christiansen, Former Chief, U.S. Forest Service
FROM RISK TO OPPORTUNITY
Proactive wildfire mitigation doesn’t just reduce risk—it creates opportunity. When we invest in thinning, prescribed fire, and restoration before disaster strikes, we protect homes, save lives, and support jobs in forestry, fire, and land stewardship. And when fire does come, those same investments help limit damage, reduce recovery costs and open new economic pathways in restoration, construction, and innovative wood products.
The difference is tangible. In some communities, proactive treatments have slowed fast-moving flames and given firefighters critical time to defend neighborhoods. In others, where investments lagged, the consequences were devastating.
A Tale of Two Fires
The 2021 Dixie Fire burned nearly 1 million acres, destroying the town of Greenville, CA, and overwhelming firefighters with extreme, fast-moving fire behavior due to hazardously overfueled, tinder-dry forests in the region32. That same year, South Lake Tahoe met a different fate when the Caldor Fire barrelled toward the city of 21,000 under similar conditions. Thanks to years of strategic fuel reduction, the Caldor fire slowed at key points, giving firefighters the precious time and space needed to save homes and neighborhoods33.
Dixie Fire

A Red Cross volunteer surveys the devastation of downtown Greenville, California, after the Dixie Fire tore through the Northern Sierra town in August 2021. In a matter of hours, the fire erased nearly 140 years of history—destroying over 75% of the town, including homes, businesses, schools, and civic buildings. The Dixie Fire ultimately scorched 963,309 acres, making it the largest single-source wildfire in California history, and caused more than $1.15 billion in damages.
Photo: Scott Dalton / American Red Cross
Caldor Fire

The Caldor Fire scar remains visible one year later above the Christmas Valley neighborhood in South Lake Tahoe, where proactive fuel treatments helped protect hundreds of homes during the 2021 blaze. Strategic thinning and defensible space along the ridgeline and near the community gave firefighters critical time to defend properties, preventing the fire from spreading into the densely populated neighborhood below. Photo: Karen Cutter, Lee Goss & Solomon Nunnally / Keep Tahoe Blue
Where proactive treatments were in place, they worked. Where they weren’t, the consequences were irreversible.
This is the power, and the urgency, of getting ahead of fire.
The Caldor Fire’s story shows more than avoided losses—it reveals the dual return on resilience. Where treatments were implemented, communities avoided both destruction and the costly, years-long process of recovery. In contrast, towns like Greenville lost everything—including their local economies.
Scaling Resilience: Turning Wildfire Risk into Rural Jobs and Healthy Forests

Real-world resilience in action: Portland International Airport’s new terminal uses regionally sourced cross-laminated timber (CLT) made possible by forest restoration projects that reduce wildfire risk. By connecting hazardous fuels reduction with innovative wood markets, projects like this support rural economies, advance climate goals, and demonstrate how proactive land management can create tangible community benefits. Photo credit: By SounderBruce
Stories like the Caldor Fire aren't just about saving homes—they show how wildfire investment can revitalize entire regions. Proactive treatments don’t just reduce fire intensity; they unlock co-benefits that ripple across landscapes and economies. In rural areas, fuel reduction supports jobs in forestry, fire, and restoration. Mechanical thinning provides material for cross-laminated timber (CLT), bioenergy, biofuels, biochar, and other innovative wood products34. In fire-adapted ecosystems, these treatments can also reintroduce beneficial fire and restore forest health.
Investing in wildfire resilience doesn’t mean choosing between safety and economic opportunity—it means aligning them. Projects like Caldor Fire and the Black Hills landscape show what’s possible when science, collaboration, and investment work together.
We have the knowledge. We have the tools. The question is: will we use them?

Photo by Ingemar Johnsson on Unsplash
Act now
Right now, decisions are being made in Congress, state legislatures, and local planning offices. With them comes an unprecedented opportunity to shift from reaction to action.
The evidence is clear. Advanced modeling and decision-support tools show that targeted wildfire investments can prevent billions in losses, protecting communities, critical infrastructure, water supplies, wildlife, and local economies. The science tells us where action is needed. The tools exist. What we need now is the political will to act –to protect lives and communities, stabilize insurance markets, and safeguard the water, wildlife, and recreation resources that define our way of life.
This will take all of us.
- If you're a policymaker: Champion wildfire resilience funding in upcoming budget negotiations. Support legislation that allocates and protects budgets for proactive treatments alongside reactive response. Your district likely has at-risk communities that could benefit from strategic investment to avoid catastrophic loss.
- If you're a managing agency or fire planning team: Leverage commercially available decision-support tools that harness modern technology to identify high-impact treatment zones, stretch limited resources, and coordinate across jurisdictions. The tools exist to do this work smarter and faster. New public-private partnership pathways can ensure they are deployed at scale.
- If you're a community leader: Engage with your regional planning authorities about wildfire risk assessment and treatment prioritization. The tools to protect your community exist—but they require local advocacy and coordination.
- If you're a concerned citizen: Get involved in your community's wildfire preparedness efforts—because individual preparation multiplies the effectiveness of broader investments. Start a FireWise or Fire Ready Neighborhood program in your community.
The choice is ours—and the time is now. Every year we invest strategically, we save lives, protect property, and restore balance to fire-adapted landscapes

Image credit: mikhail serdyukov on Unsplash
What’s Next
This is the first in a multi-part effort to turn insight into impact. Next, we’ll examine what past investments have achieved—quantifying how proactive treatments have reduced wildfire risk, protected homes, and improved outcomes on the ground. By spotlighting both successes and missed opportunities, we can identify what works and where gaps remain.
Then, we’ll look ahead—modeling how different levels of future investment could shape outcomes across community safety and protection, while improving water quality, biodiversity, and economic resilience. This forward-looking analysis will expand the interactive platform, enabling users to explore both historical results and future scenarios to inform resilience funding and the public.
Together, these efforts form a data-driven roadmap for action, helping decision-makers invest wisely, scale what works, and secure lasting resilience for communities and landscapes alike.
methodology
HOW AVOIDED CONDITIONAL LOSS WAS DETERMINED
Avoided Conditional Loss calculations leveraged Vibrant Planet’s treatment scenario and risk reduction calculation methodologies, which are available in the Vibrant Planet Platform. The platform combined fire behavior modeling, geospatial overlays, resource and asset response functions to planned and unplanned disturbances, and economic valuation to estimate potential avoided losses from proactive wildfire treatments. Steps are summarized below, with additional details available in a comprehensive report.
- Step 1 – Selecting a Planning Area: Although there are over 300 communities that are at similar or greater exposure than Palisades and Altadena, CA18, a subset was chosen to highlight well known communities that have significant exposure to wildfire from adjacent public lands where investment in treatment can significantly influence community exposure.
- Analysis areas were derived from city limit boundaries plus 2-mile buffer to account for wildfires that could start in adjacent wildlands but have a high probability of affecting the community.
- Step 2 – Data Sources: Vibrant Planet gathers and maintains many of the platform's data inputs. These are further described in the Vibrant Planet Platform (VPP) Product Guide but a few examples are noted below.
- Physical data- building footprints, utility lines, WUI defense zones, communication infrastructure–and other socioecological data–cultural and recreation sites, sources of drinking water - were sourced from Vibrant Planet internal datasets as described in the VPP Product Guide.
- Pyrologix fire behavior modeling evaluated numerous characteristics, including wildfire intensity and burn probability. Intensity was modeled using WildEST36, a proprietary scripted geospatial modeling process developed and implemented by Pyrologix that performs deterministic FlamMap simulations under 216 various weather conditions. Burn probability was modeled with the Large Fire Simulation Model (FSim), which simulates the growth and behavior of hundreds of thousands of fire events influenced by historical fire occurrence, weather, terrain, and fuel conditions37.
- Step 3 – Setting Scenario Design: To build projects that maximize treatment impact and potential avoided loss in the VPP, users weigh the importance of different management objectives (e.g., safety, asset protection, water, recreation, biodiversity, etc) and set resource constraints.
- For each community buffer area included in this analysis, scenarios emphasized safety and asset protections but could include treatments that had a cobenefit of protecting and or enhancing other objectives (e.g., water, recreation, biodiversity).
- By using a cumulative distribution function curve of resilience opportunities based on each community's unique wildfire exposure matrix, an assessment was made to determine what management constraints (e.g. number and size of projects) were needed to meet an optimal resilience target for that community. (e.g., Flagstaff has a bigger community footprint and more distributed infrastructure in the WUI; equates to more work needed to meet that resilience target)
- Step 4 – Optimizing Treatment Selection: Using the scenario design set above and an integration of wildfire risk modeling by Pyrologix, a United States Forest Service spatial optimization tool , ForSys38,39, calculated the change in wildfire exposure to safety and assets across a range of treatment options (e.g., mechanical thinning of fuels, controlled burns) to determine where and what treatment would buy down the most risk.
- Prioritization: Selected treatment projects were then sequenced by project to maximize safety and asset protection within the defined scenario constraints.
- Net Treatment Cost: Critical for comparing to avoided conditional loss, the net cost of treatments included the total estimated treatment cost (e.g., labor and workforce requirements, treatment type cost per acre, etc), minus any timber value offset (where applicable) using average contract costs and timber values across the western United States (see the VPP Product Guide for details).
- Changes in Predicted Fire Behavior: Research and empirical studies have demonstrated proactive treatments that alter fuels change fire behavior.
- Reductions in fire intensity, spread rate, and burn probability were drawn from treatment-based changes in vegetative fuels. Changes were incorporated into fuelscape datasets, which serve as inputs to the Pyrologix fire behavior modeling
- Step 5 - Avoided Loss Calculation: Avoided conditional loss was calculated by multiplying the change in Damage Potential36 by the estimated structure rebuild value. Damage Potential is a measure of the potential for structure loss given an exposure to flames and embers, incorporating the fuel, climate, and topography at each structure. A change in Damage Potential results from modeled reductions in fire behavior (both direct flame exposure and indirect ember loading) that result from proposed treatments. The resulting avoided conditional loss value represents the dollar value of loss avoided if a fire were to occur.
- Structure value ranges can vary significantly across locations and regions based on labor availability and costs, site conditions, design, and materials and did not include the land or related post-fire costs (e.g., permitting, utility repair, drinking water remediation, debris removal, or other site remediation).
- Our conservative estimates were determined based on local rebuild costs per square foot based on data analysis of the National Structure Inventory dataset40 and the top three internet search results from home builders websites, media outlets, or insurance companies for each location41-63. The lowest and highest values reported provided the range from which the midpoint was calculated and used in the avoided loss calculated assuming an average square footage of 2000 sq. ft24.
- Alamagordo, NM: $140/sq ft (range: $100-$180)
- Big Sky, MT: 325/sq ft (range: $200-$40)
- Boulder, CO: $300/sq ft (range: $200-$400)
- Cedar City, UT $160/sq ft (range: $110 - $210)
- Elko, NV: $190/sq ft (range: $130 - $250)
- Flagstaff, AZ: $250/sq ft (range: $114-$386)
- McCall, ID: $275/sq ft (range: $200-$350)
- For estimating the direct structure value at risk at a national scale, we multiplied the number of identified structures by up to $300 per square foot for an average square footage of 2,000.
Methodology adapted from Vibrant Planet’s planning workflows and ROI modeling practices. To learn more connect with us.
Citations:
- National Interagency Fire Center (NIFC). “Statistics.” National Interagency Fire Center. 2025. Available at: https://www.nifc.gov/fire-information/statistics.
- “Monitoring Trends in Burn Severity. Data Download.” MTBS. [Accessed 2025 Jun 3]. Available at: https://www.mtbs.gov/.
- “Climate Change Indicators: Wildfires.” US Environmental Protection Agency. 2016. Available at: https://www.epa.gov/climate-indicators/climate-change-indicators-wildfires.
- Cartier KMS. “U.S. Fires Quadrupled in Size, Tripled In Frequency in 20 Years.” Eos. 2022. Available at: https://eos.org/articles/u-s-fires-quadrupled-in-size-tripled-in-frequency-in-20-years
- Kluger J. “It’s Time to Redefine Megafires in the Climate Change Era.” TIME. 2024 Oct 25; Available at: https://time.com/7098778/redefine-us-megafire-climate-change-study/
- Cunningham CX, Williamson GJ, Bowman DMJS. “Increasing Frequency and Intensity of the Most Extreme Wildfires on Earth.” Nature Ecology and Evolution. 2024 8(8):1420–5.
- Balch JK, Iglesias V, Mahood AL, Cook MC, Amaral C, DeCastro A, et al. “The Fastest-Growing and Most Destructive Fires in the US (2001 to 2020).” Science. 2024 Oct 25;386(6720):425–31.
- “U.S. Congress Joint Economic Committee Democrats Report on Cost of Climate-Exacerbated Wildfires.” Wildfire Task Force. 2023. Available at: https://wildfiretaskforce.org/joint-economic-committee-democrats-report-on-cost-of-climate-exacerbated-wildfires/.
- “Cascading wildfire insurance issues impact local and state budgets.” Headwaters Economics. 2025 Jan. Available at: https://headwaterseconomics.org/natural-hazards/wildfire-insurance-local-state-budgets/
- Lawson M. “Future-Proofing the Outdoor Recreation Economy.” Headwaters Economics; 2024 Nov. Available at: https://headwaterseconomics.org/outdoor-recreation/future-proofing-the-outdoor-recreation-economy/
- Ma F, Lee JY, Camenzind D, Wolcott M. “Probabilistic Wildfire Risk Assessment Methodology and Evaluation of a Supply Chain Network.” International Journal of Disaster Risk Reduction. 2022 Nov 1;82:103340.
- “Hazardous Fuel Management. Wildfire Risk to Communities.” Wildfirerisk.org. Available at: https://wildfirerisk.org/reduce-risk/fuel-treatments/. [Accessed 2025 Jun 3]
- Davis KT, Peeler J, Fargione J, Haugo RD, Metlen KL, Robles MD, et al. “Tamm Review: A Meta-Analysis of Thinning, Prescribed Fire, and Wildfire Effects on Subsequent Wildfire Severity in Conifer Dominated Forests of the Western US.” Forest Ecology and Management. 2024 Jun 1;561:121885
- Petersen M. “California utility customers could get stuck with a big bill for the Eaton fire.” Los Angeles Times. 2025 Jun 16. Available at: https://www.latimes.com/environment/story/2025-06-16/tens-of-millions-of-californians-could-pay-more-for-electricity-because-of-the-eaton-fire
- Rengers FK, Bower S, Knapp A, Kean JW, vonLembke DW, Thomas MA, et al. “Evaluating Post-Wildfire Debris-Flow Rainfall Thresholds and Volume Models at the 2020 Grizzly Creek Fire In Glenwood Canyon, Colorado, USA. Natural Hazards and Earth System Science. 2024 Jun 28;24(6):2093–114.
- “Wildfires Burning Through State Budgets.” The Pew Charitable Trusts. 2022. Available at: https://www.pew.org/-/media/assets/2022/11/wildfires-burning-through-state-budgets.pdf
- Jaffee M, Scott JH, Callahan MN, Dillon GK, Karau EC, Lazars MT. “Wildfire Risk to Communities: Spatial Datasets of Wildfire Risk for Populated Areas in the United States.” US Forest Service. Fort Collins, CO; 2024. Available at: https://www.fs.usda.gov/rds/archive/catalog/RDS-2020-0060-2
- U.S. Forest Service. Wildfire Risk to Communities | Risk to Potential Structures [dataset]. [cited 2025 Jun 18]. Available from: https://wildfirerisk.org/download/
- Pyne SJ. “How Humans Made Fire, and Fire Made Us Human.” Aeon, 2015. Available at: https://aeon.co/essays/how-humans-made-fire-and-fire-made-us-human
- Pyne SJ. The Pyrocene: How We Created An Age Of Fire, and What Happens Next. University of California Press, 2022. 192 p.
- Shlisky A, Waugh J, Gonzalez P, Gonzalez M, Manta M, Santoso H, et al. “Fire, Ecosystems, & People: Threats and Strategies For Global Biodiversity Conservation.” The Nature Conservancy. 2007 p. 28. Available at: https://www.conservationgateway.org/Files/Documents/fire_ecosystems_and_people.pdf
- Parks SA, Holsinger LM, Blankenship K, Dillon GK, Goeking SA, Swaty R. “Contemporary Wildfires are More Severe Compared to the Historical Reference Period in Western US Dry Conifer Forests.” Forest Ecology and Management. 2023 Sep 15;544:121232.
- Parks SA, Guiterman CH, Margolis EQ, Lonergan M, Whitman E, Abatzoglou JT, et al. “A Fire Deficit Persists Across Diverse North American Forests Despite Recent Increases in Area Burned.” Nature Communications. 2025 Feb 10;16(1):1493.
- Snow M. “How Does Wildfire Impact Wildlife and Forests?" U.S. Fish & Wildlife Service. 2022. Available at: https://www.fws.gov/story/2022-10/how-does-wildfire-impact-wildlife-and-forests. [Accessed 2025 Jun 3]
- Paci J, Newman M, Gage T. “The Economic, Fiscal, and Environmental Costs of Wildfires in California.” The Gordon and Betty Moore Foundation. 2023. Available at: https://www.moore.org/docs/default-source/default-document-library/the-economic-fiscal-and-environmental-costs-of-wildfires-in-ca.pdf
- Barrett K. “Wildfires Destroy Thousands of Structures Each Year.” Headwaters Economics. 2025. Available at: https://headwaterseconomics.org/natural-hazards/structures-destroyed-by-wildfire/
- Moritz MA, Batllori E, Bradstock RA, Gill AM, Handmer J, Hessburg PF, et al. “Learning to Coexist With Wildfire.” Nature. 2014 Nov;515(7525):58–66.
- “Where Humans and Forests Meet: The Rapidly Growing Wildland-Urban Interface.” Rooted in Research. 2024. Available at: https://research.fs.usda.gov/treesearch/67667
- “Wildland-Urban Interface Growth in the U.S.” US Forest Service. 2023 Jul 12; Available at: https://research.fs.usda.gov/nrs/projects/wuigrowth
- International Code Council (ICC). “Fire Resistant Construction in the Wildland-Urban Interface.” ICC. 2021. Available at: https://www.iccsafe.org/products-and-services/wildland-urban-interface/. [Accessed 2025 Jun 3]
- Walls M, Wibbenmeyer M. “Shaping Land Use Patterns in the Wildland-Urban Interface: The Role Of State And Local Governments In Reducing Exposure To Wildfire Risks.” Resources for the Future. 2025. Available at: https://www.rff.org/publications/reports/shaping-land-use-patterns-in-the-wildland-urban-interface-the-role-of-state-and-local-governments-in-reducing-exposure-to-wildfire-risks/. [Accessed 2025 Jun 3]
- Iati M, Moriarty D. “Anatomy of a Wildfire: How the Dixie Fire Became the Largest Blaze of a Devastating Summer.” Washington Post. 2021 Sept 17; Available at: https://www.washingtonpost.com/climate-environment/interactive/2021/dixie-fire/
- Avitt A. “Caldor Fire: Defending Lake Tahoe Basin.” Caldor Fire. US Forest Service. 2021 Oct 21; Available at: https://www.fs.usda.gov/about-agency/features/caldor-fire-defending-lake-tahoe-basin
- Zhang B, Lan K, Harris TB, Ashton MS, Yao Y. “Climate-Smart Forestry Through Innovative Wood Products and Commercial Afforestation and Reforestation on Marginal Land.” Proceedings of the National Academy of Sciences. 2023 Jun 6;120(23):e2221840120.
- Moseley C, Reyes YE. “Forest Restoration and Forest Communities: Have Local Communities Benefited From Forest Service Contracting of Ecosystem Management?” Environmental Management. 2008 Aug;42(2):327–43.
- Scott JH, Moran CJ, Callahan MN, Brough AM, Thompson MP. “Methods and Outputs of the Wildfire Exposure Simulation Tool (WildEST).” Pyrologix; 2024 [accessed 2025 Jun 3]. Available at: https://osf.io/eyfrt
- Scott JH, Short KC, Finney MA. “FSim: The Large-Fire Simulator Guide to Best Practices.” Pyrologix. 2018; Available at: https://pyrologix.com/wp-content/uploads/2019/11/FSimBestPractices_0.3.1.pdf
- Day MA, Ager AA, Houtman RM, Evers CR. “Prioritizing Restoration and Risk Reduction Landscape Projects with the ForSys Planning System.” Gen Tech Rep RMRS-GTR-437 Fort Collins CO. US Department of Agriculture Forest Service. Rocky Mountain Research Station. 51 p. 2023;437. Available at: https://research.fs.usda.gov/treesearch/67581
- Ager AA, Day M. “ForSys - Scenario Planning Model For Multi-Objective Restoration And Fuel Management Planning.” US Forest Service. 2023 Feb 23; Available at: https://research.fs.usda.gov/rmrs/projects/forsys
- “National Structure Inventory (NSI).” US Army Corps of Engineers. 2025. Available at: https://www.hec.usace.army.mil/confluence/nsi.
- “2025 Home Renovation Cost Calculator | Alamogordo, New Mexico.” Manta. [Accessed 2025 Jun 10]. Available at: https://www.manta.com/cost-home-renovation-alamogordo-nm.
- “Home Builders in Alamogordo, NM.” Homeyou. Available at: https://www.homeyou.com. [Accessed 2025 Jun 10]
- “Montana Home Construction Cost Calculator.” Tri River Construction. [Accessed 2025 Jun 10]. Available at: https://tririverconstruction.com/cost-calculator/
- Jaybhaye H. “How Much Does It Cost to Build a House in Montana in 2025?” Houzeo Blog. 2025 [Accessed 2025 Jun 10]. Available at: https://www.houzeo.com/blog/how-much-does-it-cost-to-build-a-house-montana/
- “How Much Does it Cost Per Square Foot to Build a Home?” Big Sky Builders. 2022 [Accessed 2025 Jun 10]. Available at: https://bigskybuilders.net/how-much-does-it-cost-per-square-foot-to-build-a-home/
- “Boulder County Residential Construction Costs.” Home Builders Association of Metro Denver. 2022 [accessed 2025 Jun 10]. Available at: https://www.hbadenver.com/2022/02/28/boulder-county-residential-construction-costs/
- “Cost to Build a House in Boulder, Colorado.” HomeBlue. 2024 [accessed 2025 Jun 10]. Available at: https://www.homeblue.com/home-building/boulder-co-cost-to-build-a-house.htm
- “Will My Homeowners Insurance Rebuild My Home In The Event Of A Total Loss (2022).” Mile High Insurance Brokers. 2022 [accessed 2025 Jun 10]. Available at: https://www.milehighinsurancebrokers.com/article/will-my-homeowners-insurance-rebuild-my-home-in-the-event-of-a-total-loss-2022
- “Accurate Cost-to-Build a House Calculator - Building a House in Nevada.” Home-Cost. 2024 [accessed 2025 Jun 10]. Available at: https://www.home-cost.com/building-a-house-in-nevada/
- “Custom Home Builders in Elko, NV.” Homeyou. [accessed 2025 Jun 10]. Available at: https://www.homeyou.com
- “Bailey Homes.” Elko Home Builders. [accessed 2025 Jun 10]. Available at: https://www.newhomeselko.com
- “2025 Home Builders Cost Calculator | Elko, Nevada.” Manta. [accessed 2025 Jun 10]. Available at: https://www.manta.com/cost-home-builders-elko-nv
- Jaybhaye H. “How Much Does It Cost to Build a House in Nevada in 2025?” Houzeo Blog. 2025 [accessed 2025 Jun 10]. Available at: https://www.houzeo.com/blog/how-much-does-it-cost-to-build-a-house-nevada/
- “Cost To Build A House In Flagstaff AZ.” MK Design & Build. 2021 [accessed 2025 Jun 10]. Available at: https://www.mkdesignandbuild.com/cost-to-build-a-house-in-flagstaff-az/
- Behere B. “How Much Does It Cost to Build a House in Arizona in 2025?” Houzeo Blog. 2025 [accessed 2025 Jun 10]. Available at: https://www.houzeo.com/blog/how-much-does-it-cost-to-build-a-house-arizona/
- “2025 House Builders Cost Calculator | Flagstaff, Arizona.” Manta. [accessed 2025 Jun 10]. Available at: https://www.manta.com/cost-house-builders-flagstaff-az
- “Oakmont Custom Homes - Custom Home Builders in McCall, Idaho.” Home Builders McCall, ID. [accessed 2025 Jun 10]. Available at: https://buildwithoakmont.com/cities/home-builders-mccall-idaho/
- “Home Builders in McCall, Idaho.” [accessed 2025 Jun 10]. Available at: https://pinetopmccall.com/
- Behere B. “How Much Does It Cost to Build a House in Idaho in 2025?” Houzeo Blog. 2025 [accessed 2025 Jun 10]. Available at: https://www.houzeo.com/blog/how-much-does-it-cost-to-build-a-house-idaho/
- “Cost to Build a House in Cedar City, Utah.” HomeBlue. [accessed 2025 Jun 10]. Available at: https://www.homeblue.com/home-building/cedar-city-ut-cost-to-build-a-house.htm
- “Home-Cost | Accurate Cost-to-Build a House Calculator - Cost Per SF by State.” Home-Cost. 2024 [accessed 2025 Jun 10]. Available at: https://www.home-cost.com/cost-per-sf-by-state
- Behere B. “How Much Does It Cost to Build a House in 2025?”. Houzeo Blog. 2025 [accessed 2025 Jun 10]. Available at: https://www.houzeo.com/blog/how-much-does-it-cost-to-build-a-house/
- Cost to Construct a Home Rose Significantly Over Last Two Years.” National Association of Home Builders. 2025. Available at: https://www.nahb.org/blog/2025/01/cost-of-construction-survey-2024
- “CHARS - Highlights.” US Census Bureau. 2024 [cited 2025 Jun 3]. Available at: https://www.census.gov/construction/chars/highlights.html