Crown Fire Probability
Where are crown fires most likely? This dataset highlights the probability of canopy-driven fire across the U.S. under a full range of weather conditions.

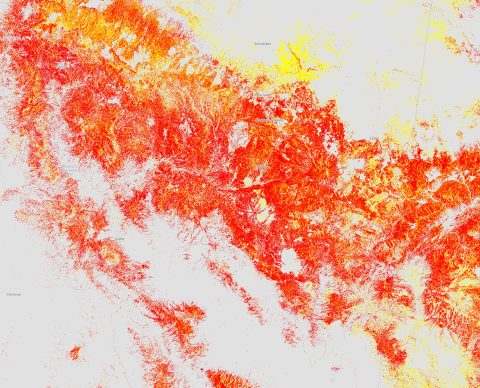
About this dataset
This dataset maps the probability of crown fire across the contiguous United States under a full range of historical weather conditions, as modeled by WildEST. Values range from 0–1, representing the likelihood that a given location will experience either group torching (mid- to high-grade passive crown fire) or sustained canopy spread (active crown fire) if a wildfire occurs. Probabilities are weighted by weather frequency and fire-carrying ability.
What’s included in this dataset
How to interpret this layer
- Crown Fire Probability raster (30 m resolution, CONUS)
- Continuous values from 0–1 indicating the likelihood that, if a wildfire occurs, conditions at that location would support passive or active crown fire behavior.
- Cloud-Optimized GeoTIFF (COG) formatted for efficient streaming and analysis.
- Areas without canopy fuels are coded as 0.
Explore the full Data Story
To dive deeper into the methods, context, and example applications behind this dataset, explore the full VPDC Data Story that accompanies it.
See the full Data Story ⭢How to get started
- Explore the map: Zoom and pan to locate your area of interest. The tile grid outlines the spatial boundaries of the dataset.
- Select your tiles: Click one or more tiles to highlight them. Each tile corresponds to a geographic area you can download.
- Review & adjust: Use the checkboxes in the selection list to confirm or deselect tiles.
- Download your data: Click the "Download Data" button to bundle your selected tiles into a single ZIP file .
A few things to keep in mind:
- Download limitations: For best performance, please select no more than 20 tiles per download. Larger selections may slow your browser or cause issues.
- Need more coverage? No problem—just download in smaller batches. All tiles use the same folder structure, so you can easily merge them later in your GIS software for seamless regional analysis.
- Working at larger scales? For very large areas, contact us to discuss alternative delivery options.
- Tiling grid: To keep downloads efficient and analysis straightforward, the dataset is organized into a fixed tiling grid. This approach prioritizes optimal file sizes and regional coverage for analytical workflows. While the grid follows standard geospatial conventions, it is not pixel-aligned to USGS ARD or other standardized grids.
Download
Crown Fire Probability
Where are crown fires most likely? This dataset highlights the probability of canopy-driven fire across the U.S. under a full range of weather conditions.
Direct Download (Full File) - HTTPS Link
Use this link to download the entire file directly to your local storage through the browser. This method is ideal for quick and easy access but requires sufficient local storage and bandwidth for the full download.
Download data:
Heading
Explore scenario data downloads
Use the filters, then click a group to reveal individual downloads.
Download tiled data:
Selected Data Tiles:
Direct Access
Get hands-on access to this dataset using interactive notebooks. Choose between the Google Colab notebook for quick exploration in your browser or access the hosted Jupyter Notebooks via Binder or GitHub for more advanced workflows.

Direct access to the Google Collab notebook
Open and explore instantly
Click the button to the left to launch an interactive notebook directly in your browser. This pre-configured Colab notebook provides a quick and easy way to explore, visualize, and analyze the data—no setup required.
GitHub hosted Jupyter Notebooks
Flexible access for advanced workflows
Access the full collection of Jupyter Notebooks hosted on GitHub. These notebooks can be used on your local machine or via cloud platforms like Binder or Google Colaboratory, providing flexibility for more advanced customizations.
Licensing & Attribution
Licensed under Creative Commons Attribution–NonCommercial–ShareAlike 4.0 International (CC BY-NC-SA 4.0).
You may share and adapt this dataset for noncommercial purposes with attribution under the same license.
Required Attribution:
© 2025 Pyrologix, a Vibrant Planet company. Distributed by Vibrant Planet Data Commons. Licensed under CC BY-NC-SA 4.0.
For commercial or special-use requests, email us at contact@vpdatacommons.org
Disclaimer
Vibrant Planet provides the information hosted on the Vibrant Planet Data Commons site (www.vpdatacommons.org) (the “Site”) as a PUBLIC SERVICE for NONCOMMERCIAL USES only. The information is provided as-is, as-available, and without warranty of any kind, whether express, implied, or statutory, concerning the accuracy, completeness, reliability, or suitability of the information. Further, we do not warrant that this site will (i) be uninterrupted or error-free; or (ii) result in any desired outcome. We are not responsible for content of other services, data or public information that may be used by or linked to this site. By accessing this website and/or the data contained within, you assume the entire responsibility and liability related to the use of the information it contains, and you release Vibrant Planet Data Commons, Vibrant Planet and all data providers from liability. You may use the Site only for lawful purposes Users also should note that property boundaries included on any map do not represent an on-the-ground survey suitable for legal, engineering, or surveying purposes. They represent only the approximate relative locations. We reserve the right to withdraw or amend this Site, and any service or material we provide on the Site, in our sole discretion without notice. We will not be liable if for any reason all or any part of the Site is unavailable at any time or for any period. From time to time, we may restrict access to some parts of the Site, or the entire Site to users or visitors to the site. The Site and its entire contents, features, and functionality (including but not limited to all information, software, text, displays, images, video, and audio, and the design, selection, and arrangement thereof) are owned by Vibrant Planet Data Commons, its licensors, or other providers of such material and are protected by United States and international copyright, trademark, patent, trade secret, and other intellectual property or proprietary rights laws. This site is operated by Vibrant Planet Data Commons.