Crown Fire Probability

Photo by Vanessa Bucceri on Unsplash
Protecting America's Forests: Advanced Crown Fire Probability Mapping
Wildfires don’t always stay on the ground. In the right conditions, flames can climb into the forest canopy and race from treetop to treetop as crown fires—the most dangerous and destructive type of wildfire. This dataset shows where those conditions are most likely to occur across the U.S., highlighting areas where forests face the highest risk of canopy-driven fire behavior.
In September 2020, California’s Creek Fire1 exploded across the Sierra Nevada, burning more than 379,000 acres and creating towering pyrocumulonimbus clouds that reached the stratosphere. It wasn’t just the scale of the blaze that shocked fire crews and communities—it was the way flames leapt from treetop to treetop, racing through dense stands of pine and fir with a ferocity that defied control. This is a hallmark of a crown fire, one of the most destructive forms of wildfire behavior for forests not adapted to it. Understanding when and where these dangerous transitions occur has become critical for fire management.
Not all fires climb into the canopy. Many remain surface fires, burning brush and litter while leaving much of the forest intact. But when conditions align—abundant ladder fuels, continuous tree crowns, strong winds, and dry air—a ground fire can surge upward, torching individual trees and then racing through the canopy. With enough wind and fuel, it becomes a crown fire that generates its own weather, showers embers miles around, and overwhelms even the most effective suppression efforts. The tragic 2025 Dragon Bravo Fire2,3 on the Grand Canyon's North Rim showed this power vividly, producing massive pyrocumulus clouds while destroying the historic Lodge and more than 100 structures across 145,000 acres.
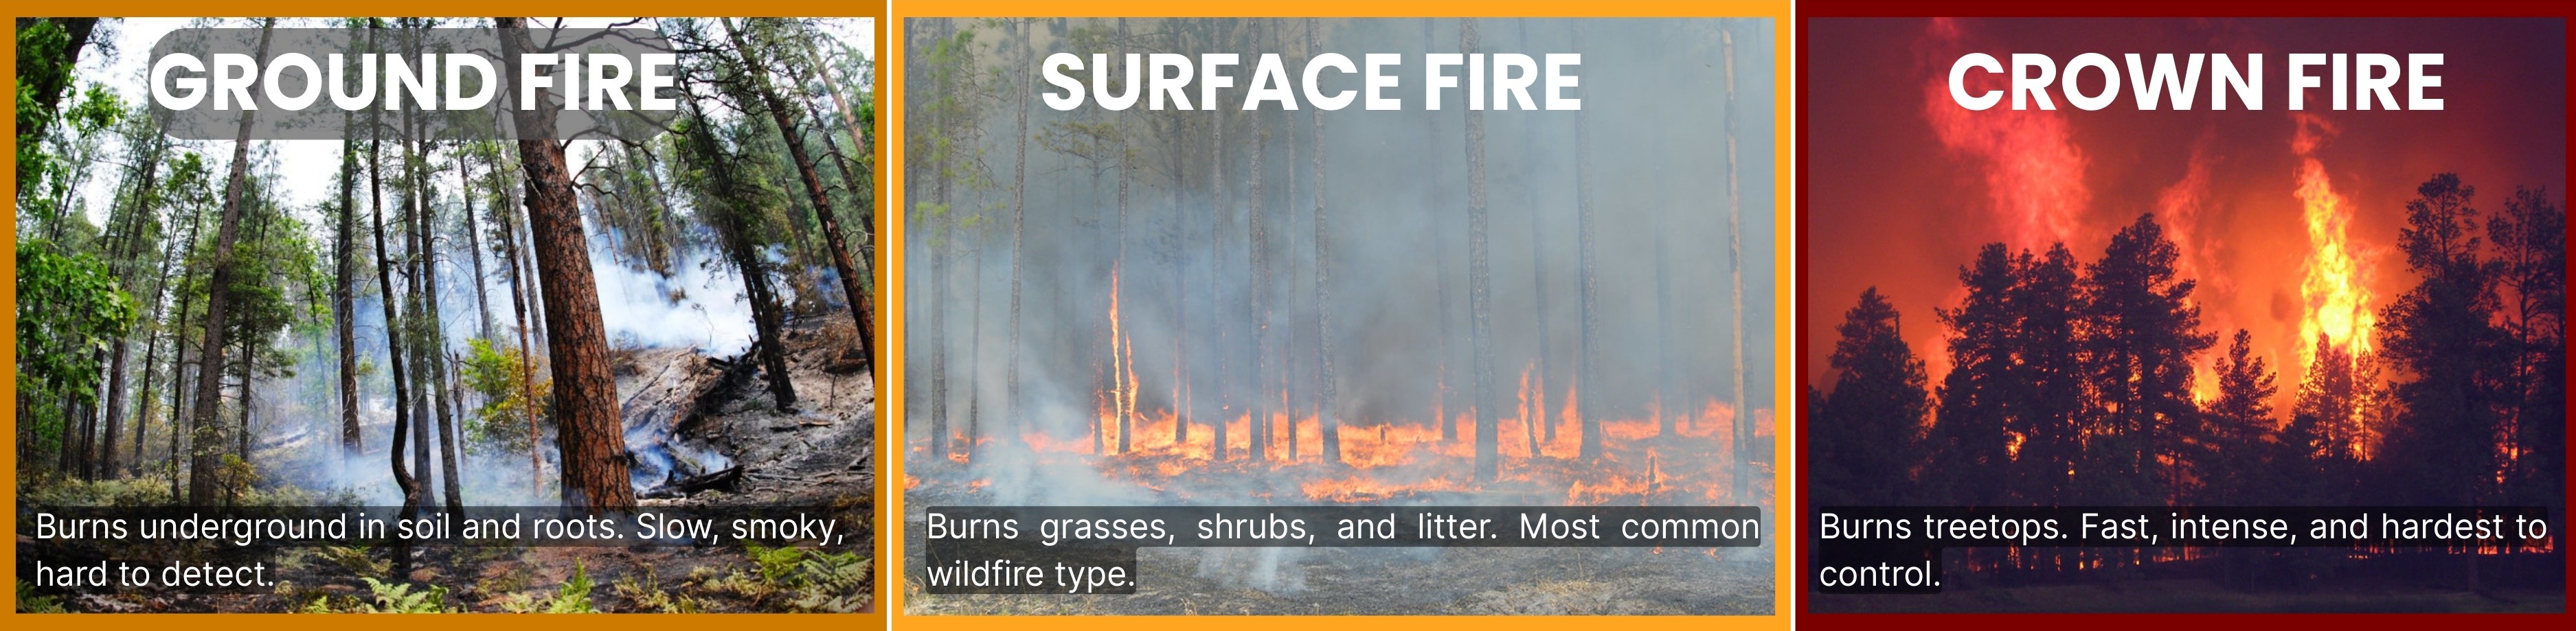
Most wildfires remain on the ground or surface, but under the right conditions they can erupt into crown fires—fast-moving canopy fires that are hardest to control. infographic created by Vibrant Planet Data Commons.
Recognizing these patterns, scientists at Pyrologix have developed the Crown Fire Probability dataset, the first national-scale view of where these dangerous transitions are most likely to occur. By mapping the likelihood of crown fire using local vegetation and observed fire weather conditions it provides scientists, land managers, and communities with a sharper tool for anticipating extreme fire behavior and planning accordingly.
"Active crown fires... frequently result in high rates of spread and intense burning conditions that are virtually impossible for suppression forces to control. The aftermath can lead to dramatic changes in forest structure, composition, and increased risks to both ecological and human values." - Alexander & Cruz, 2014
What is Crown Fire Probability Data?
Crown Fire Probability estimates how likely a wildfire—if it occurs—will climb from the ground into the forest canopy. It reflects both situations where groups of trees torch at once (passive crown fire) and where flames spread continuously from treetop to treetop (active crown fire). Values range from 0 to 1, where 0 means a canopy fire is not expected and 1 means it is almost certain if a fire occurs.
Unlike Burn Probability4, which measures the annual chance that a location will burn, Crown Fire Probability focuses on fire behavior once a fire is burning. Higher values indicate places where surface fires are more likely to transition into the canopy, resulting in greater fire intensity (longer flames, higher energy release) and more severe impacts on overstory trees. In other words, it helps answer a critical question: Will this fire stay manageable on the ground, or will it erupt upward into a canopy fire that is far harder to control?.

Map depicting Crown Fire Probability: Crown Fire Probability across the U.S. Colors show the likelihood that a surface fire would transition into the canopy: gray = very unlikely, soft yellow = occasional, bright yellow = moderate, dark orange = high, red = very high.
Science Behind the Map
The Crown Fire Probability dataset comes from the Wildfire Exposure Simulation Tool (WildEST)5, developed by Pyrologix. WildEST uses high-resolution fuels, topography, and weather data to simulate wildfire behavior across the full range of historical weather conditions—not just extreme scenarios, but the complete spectrum of conditions under which fires actually burn.
- Enhanced LANDFIRE Fuels & Vegetation Data (USGS/USFS) – 30-meter resolution fuelscape inputs including surface fuel models, canopy cover, canopy base height, canopy bulk density, and canopy fuel load, extensively processed and conditioned by Pyrologix to improve accuracy of fire behavior simulation.
- Digital Elevation Model (USGS) – Used for slope, aspect, and topographic conditioning of fuels and fire spread.
- Gridded Historical Weather Data (gridMET, ERA5, RTMA, and related datasets) – Provides long-term wind speed, wind direction, temperature, and relative humidity inputs.
- WindNinja (USDA Forest Service, Missoula Fire Sciences Laboratory) – Downscales winds to 120-meter resolution to account for terrain effects.
- WildEST/FlamMap Fire Behavior Modeling (Pyrologix, USDA Forest Service Fire Sciences Lab) – Generates fire type probabilities (surface, underburn, passive crown, active crown) and calculates 95th percentile flame lengths and intensities.
Geography
The Crown Fire Probability dataset covers the conterminous United States at 30-meter resolution—spanning approximately 3.1 million square miles and 2 billion acres of landscape. This comprehensive, wall-to-wall coverage enables fire managers in Montana to use the same methodology and data standards as their counterparts in California, allowing for consistent risk assessment across all jurisdictional boundaries.
At 30-meter resolution, each pixel covers roughly the area of a baseball diamond, providing the spatial precision needed to distinguish crown fire risk between individual forest stands, fuel complexes, and terrain features within the same watershed.
The massive national dataset is divided into a custom analytical tiling grid (see map), allowing researchers, land managers, and planners to efficiently download only the regions they need—whether analyzing an entire state, a national forest, or planning defensible space around a specific community.
To download and explore the data, go HERE.

Are you interested in exploring or applying this dataset in your work?
We want to hear from you!
Vibrant Planet and Vibrant Planet Data Commons are actively tracking how their datasets are used to support impactful wildfire management and research. Contact us to share your ideas, feedback, or success stories, and help us make data-driven solutions a reality.
Why This Dataset Matters: Science, Management, and Policy Applications
Crown fires represent some of the most dangerous and destructive wildfire behavior, capable of generating their own weather systems, creating fire tornadoes, and producing ember showers that can ignite new fires miles ahead of the main fire front. By showing where canopy fires are most likely to occur under extreme conditions, this dataset provides critical insights across multiple domains:
Fire Behavior Science and Prediction
Crown Fire Probability helps fire scientists and incident commanders identify forests where surface fires are most likely to transition into uncontrollable canopy fires. This information is essential for:
- Suppression Strategy Development: Understanding where crown fires are likely helps incident commanders position resources and develop suppression tactics before fires reach critical intensity.
- Fire Weather Forecasting: Integration with weather prediction models to provide real-time crown fire potential forecasts.
- Research Applications: Supporting studies on fire behavior, climate change impacts, and ecosystem responses to extreme fire events.
Strategic Land Management
Land managers can use these data to prioritize fuel reduction treatments such as thinning and prescribed burning. Research from the Sierra Nevada demonstrates that shaded fuel breaks and thinning treatments can significantly reduce the likelihood of crown fires7,8, with effects persisting upwards of two decades9 after the wildfire has occurred. Specific applications include:
- Treatment Prioritization: Focusing limited resources on areas with the highest crown fire potential.
- Fuel Break Placement: Strategic placement of shaded fuel breaks along ridgelines and roads in high crown fire probability zones, where they can serve as anchor points for suppression operations.
- Forest Restoration Planning: Designing treatments that reduce canopy fuel continuity while maintaining forest ecosystem functions.
Community Safety and Evacuation Planning
Communities in the wildland–urban interface face particular risks from crown fires, which can generate massive ember storms and spread too rapidly for safe evacuation. Applications include:
- Evacuation Route Planning: Identifying areas where crown fires could block or threaten evacuation corridors
- Community Wildfire Protection Plans: Supporting development of strategic fuel breaks that provide defensible positions for firefighters and safer evacuation routes for residentsFuel Break Placement
- Home Hardening Programs: Prioritizing Firewise communities and defensible space programs in areas with high crown fire potential
What is the Wildland–Urban Interface (WUI)? The wildland-urban interface (WUI) is the area where houses meet or intermingle with undeveloped wildland vegetation. As of 2020, the WUI covers 9.4 percent of the contiguous United States but is home to more than 44 million homes—32 percent of all housing nationwide11. Between 1990 and 2020, WUI areas increased by 179,000 square kilometers, an area equivalent in size to the state of Washington, making these communities increasingly vulnerable to wildfire impacts.
Policy and Investment Decisions
Policymakers gain essential insights for allocating wildfire management resources and developing regulations:
- Federal Investment: Federal Investment: Informing programs like the Wildfire Crisis Strategy that target the most fire-prone landscapes
- Infrastructure Protection: Prioritizing utility improvements and power line maintenance in high crown fire risk areas
- Insurance and Risk Assessment: Supporting actuarial assessments for property insurance and disaster planning
Climate Change Research
Scientists can explore how crown fire risk overlaps with drought, heat, and shifts in vegetation to better understand how climate change may intensify the potential for extreme fire behavior. This includes studying how warming temperatures and changing precipitation patterns affect fuel moisture and fire weather conditions that drive the development of crown fires.

Dragon Bravo Fire on the North Rim at night, showing flames lighting the sky — Photo by Matt, Adobe Stock (licensed).
Applications for Research and Land Management
Land managers, fire planners, and communities can use Crown Fire Probability maps to:
- Ecological Restoration: Managers can identify fire-excluded forests where crown fire risk is unnaturally high, underpinning decisions to restore frequent, low-intensity fire regimes through thinning and prescribed burning.
- Climate Adaptation Research: Crown fire layers are already being intersected with climate projections to prioritize adaptation efforts in vulnerable landscapes—such as identifying where canopy fire risk and drought stress co-occur.
- Post-Fire Recovery and Monitoring: These maps help guide post-fire reforestation or salvage priorities by indicating which areas are likely to experience high-severity, stand-replacing fire—critical information for long-term ecosystem recovery.
- Identify forests most vulnerable to severe crown fire behavior under extreme conditions.
- Prioritize treatments (like thinning or prescribed fire) that reduce canopy fuels and lower crown fire risk.
- Support community wildfire protection plans (CWPPs) and Firewise programs by showing local risk.
- Combine with burn probability or exposure datasets to understand both likelihood and severity of future fires.
Applied Use Case: The Critical Role of Geospatial Crown Fire Probability Data in Forest Management

Wildfire burning through the Sierra Nevada, with thick smoke rising above the forest. Photo by Chris Allan, Adobe Stock (licensed)
Real-World Results In California's Sierra Nevada, forest managers are already putting crown fire probability data to work. When the data shows steep slopes at high risk for canopy fires, managers strategically place shaded fuel breaks—150-foot-wide zones where they thin canopy fuels while keeping tree cover intact. These treated areas, positioned along ridgelines and roads, serve a triple purpose: they slow down crown fires, give firefighting crews safer places to make their stand, and buy precious time for evacuations.
The strategy is proving itself in the field. When researchers studied fuel breaks that were hit by the 2020 Creek Fire, they found something remarkable: treated areas burned with five times less severity12 and kept three times more live vegetation8 compared to nearby untreated forests. Even better, studies show these shaded fuel breaks can reduce crown fire risk for two decades or more—even after being tested by subsequent fires.
Crown Fire Probability is also being paired with other datasets to protect threatened species and critical watersheds. Ecologists overlay canopy fire risk with drought projections and habitat data to pinpoint the landscapes most at risk of both ecological collapse and community harm. This integration helps direct limited resources to the places where proactive management delivers the greatest benefit.
Looking Ahead
The Crown Fire Probability dataset represents a significant advancement in landscape-scale fire behavior modeling, offering land managers, researchers, and communities consistent, high-resolution information that was previously unavailable at the national scale. As part of the broader WildEST framework, it shows how integrating fuels, weather, and topography can produce actionable insights for planning and management.
This type of comprehensive fire behavior mapping is especially valuable as fire management shifts toward proactive, landscape-scale strategies. When paired with datasets such as burn probability or ember transport models, Crown Fire Probability helps managers identify where fuel treatments are likely to be most effective and where communities face the greatest risk from canopy-driven fires.
The methods behind this dataset also lay the foundation for continued refinement—whether through finer-resolution fuel mapping, integration of real-time weather forecasts, or linkages with post-fire recovery models. As our understanding of fire behavior grows, datasets like this provide the scientific foundation for evidence-based decision-making in an era of changing fire regimes.
By identifying where crown fires are most likely under varying weather conditions, this dataset supports strategic, landscape-level planning—an urgent need as fire seasons lengthen and fuels dry across the western United States. Anticipating canopy fire risk helps protect both vulnerable ecosystems and the communities that depend on them.

Dragon Bravo Fire on the North Rim during the day, with smoke rising over the canyon — Photo by Matt, Adobe Stock (licensed)
Explore the Data Behind the Story
Take a deeper dive into the patterns and trends shaping wildfire behavior across the U.S. Access the full datasets to analyze fire frequency, severity, and historical shifts in fire activity. Whether you're a researcher, land manager, or policymaker, this data provides the foundation for informed decision-making and action.
References
1. Stephens, S. L., et al. 2022. Mass fire behavior created by extensive tree mortality and high tree density: The Creek Fire of 2020, Sierra Nevada, California, USA. Forest Ecology and Management, 512, 120207
2. National Park Service. 2025. Grand Canyon National Park Update on Dragon Bravo Fire — July 13, 2025. U.S. Department of the Interior. Available at: https://www.nps.gov/grca/learn/news/dragon-bravo-fire-update-july-13-2025.htm [accessed September 1, 2025]
3. U.S. Forest Service. 2025. Dragon Bravo Fire Daily Update — August 13, 2025. Kaibab National Forest, U.S. Forest Service Southwest Region. Available at: http://www.fs.usda.gov/r03/kaibab/newsroom/releases/dragon-bravo-fire-daily-update-august-13-2025 [accessed September 1, 2025].
4. IFTDSS. 2012. About Landscape Burn Probability Model. Integrated Fire Treatment Decision Support System. Available at https://iftdss.firenet.gov/firenetHelp/help/pageHelp/content/20-models/lbp/aboutlbp.htm
5. Scott, J.H., Moran, C.J., Callahan, M.N., Brough, A.M., Thompson, M.P. 2024. Methods and outputs of the Wildfire Exposure Simulation Tool (WildEST). DOI: https://doi.org/10.17605/OSF.IO/VEDKC.
6. Pyrologix LLC. 2024. WildEST (Wildfire Exposure Simulation Tool) Documentation. Missoula, Montana. Available at: https://www.pyrologix.com/reports/WildEST%20Documentation.pdf
7. Finney, M. A., Seli, R. C., McHugh, C. W., & Ager, A. A. 2022. Investigating fuel treatments and their lasting effects on burn probability and crown fire in the Sierra Nevada. eScholarship University of California. https://escholarship.org/uc/item/5br7r07k
8. Keane, R. E., & Hessburg, P. F. 2023. Impacts of shaded fuel breaks on fire behavior and forest resilience in the Sierra Nevada. California Fire Science Consortium. https://static1.squarespace.com/static/545a90ede4b026480c02c5c7/t/6480b21dd4acac7a63518f96/1686155806308/Lowetal2023_CFSCBrief.pdf
9. Low, K. E., Battles, J. J., Tompkins, R. E., Dillingham, C. P., Stephens, S. L., & Collins, B. M. 2023. Shaded fuel breaks create wildfire-resilient forest stands: lessons from a long-term study in the Sierra Nevada. Fire Ecology, 19(1), 29. DOI: https://doi.org/10.1186/s42408-023-00187-2
10. U.S. Fire Administration (USFA), Federal Emergency Management Agency (FEMA). n.d. Wildland-Urban Interface. Available at: https://www.usfa.fema.gov/wui/ [accessed September 1, 2025].
11. Radeloff, V. C. 2023. Where humans and forests meet: Rapidly growing wildland-urban interface. USDA Forest Service Northern Research Station. Available at: https://research.fs.usda.gov/nrs/articles/where-humans-and-forests-meet-rapidly-growing-wildland-urban-interface [accessed September 1, 2025].
12. Finney, M. A., Seli, R. C., McHugh, C. W., & Ager, A. A. 2023. Quantifying the effectiveness of shaded fuel breaks from ground-based, aerial, and spaceborne observations: Evidence from the 2020 Creek Fire. Forest Ecology and Management, 547, 121142. https://doi.org/10.1016/j.foreco.2023.121142