

CONUS Forest Structure, Density & Products
Wall-to-wall maps of basal area, relative density, and merchantable timber volume across the contiguous United States at 30-meter resolution, produced by Vibrant Planet for American Forests.

About this dataset
This dataset contains three interconnected forest mapping layers produced by Vibrant Planet: basal area, relative density, and merchantable timber volume. Together, these layers characterize fundamental attributes of forest structure, stocking condition, and wood resource availability across all forested lands in the contiguous United States (CONUS) at 30-meter resolution.
These layers were built to provide consistent, wall-to-wall forest data for transparent vulnerability assessments and evidence-based land management, filling a persistent gap where managers need current, high-resolution data that is internally consistent across jurisdictional boundaries.
The three layers are designed to be used independently or in combination. Basal area provides a foundational measure of stand occupancy. Relative density contextualizes that occupancy against species- and site-specific carrying capacity, making it possible to identify stands that are sparsely, fully stocked, or heavily stocked regardless of forest type. Merchantable timber volume translates structure into the economic language of forest products, enabling woodshed-scale supply analyses and treatment feasibility planning.
All three layers are derived from a shared modeling pipeline that uses a Vision Transformer-based foundation model trained on Sentinel-2 satellite imagery and calibrated against lidar-derived training targets from the USGS 3DEP program. Downstream models extend these core structure estimates into relative density and timber product allocations using Forest Inventory & Analysis (FIA) data, stratified by ecoregion and forest type group. For full technical details on each model, see the model cards:
- ForestStructure v1.1.1
- ForestDensity v1.0.0
- ForestProducts v1.0.0
- ForestInnovationPlatform v1.0.0.
Rasters were produced at 10-meter native resolution and resampled to 30 meters for this release. The data are projected in NAD83 / Conus Albers (EPSG:5070).
Important limitations: These are modeled estimates based on satellite-derived predictions of forest structure. They are not direct measurements from field inventory. Accuracy varies by forest type, region, and stand condition. Users should treat these layers as planning-grade data suitable for landscape- to regional-scale analysis, and should exercise caution when interpreting results at the scale of individual pixels. See the model cards and accompanying data story for detailed performance metrics and caveats.
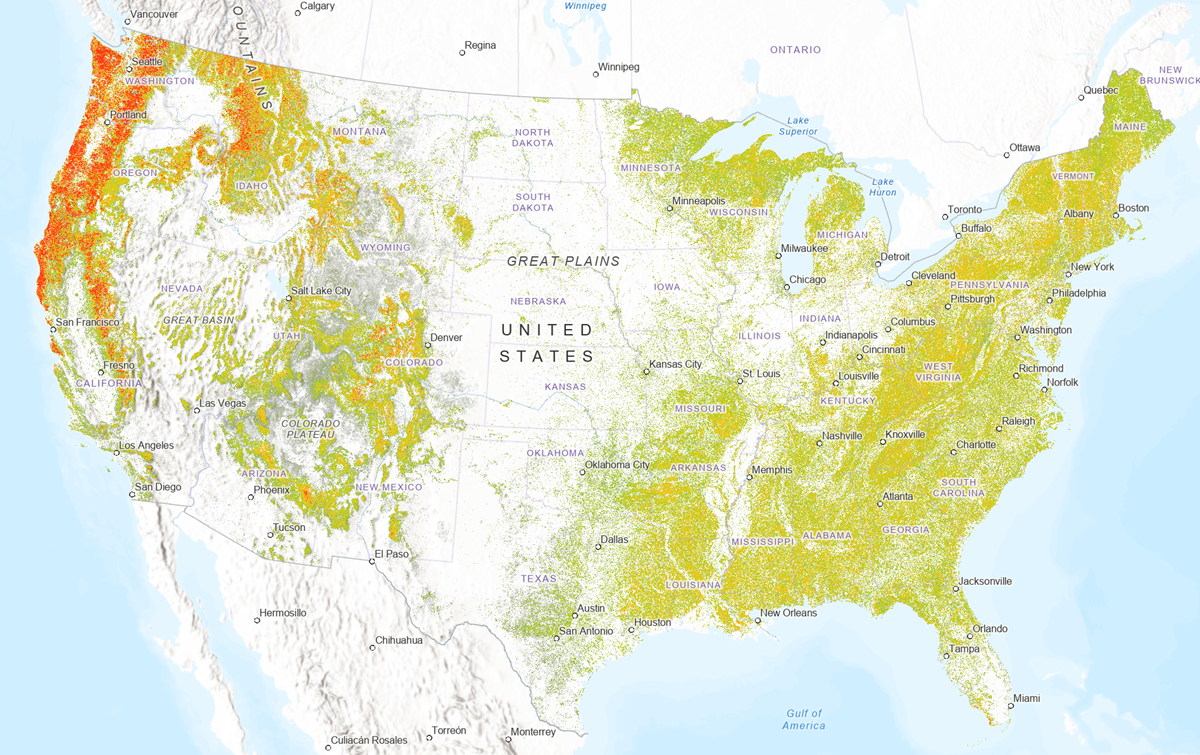
Basal area: Warm colors indicate higher density per hectare.
What’s included in this dataset
How to interpret this layer
This package contains three single-band rasters sharing a common grid (162,670 × 134,594 pixels at 30 m). All are 16-bit signed integer, DEFLATE-compressed GeoTIFFs in NAD83 / Conus Albers (EPSG:5070). NoData is encoded as -9999.
- Basal Area (BA): Estimated cross-sectional area of all live tree stems per unit land area. Values are stored directly in square meters per hectare (m²/ha). Basal area is a fundamental measure of stand occupancy used across forestry, fire behavior modeling, and ecological assessment. This layer also serves as a key input to the relative density and forest products models.
- Relative Density (RD): A measure of how fully stocked a forest stand is relative to its biological carrying capacity. Pixel values represent RD as a percentage — a value of 55 means 55% of maximum stocking (equivalent to a ratio of 0.55). Values are clamped at 200. Typical interpretation zones: below ~25 is understocked; ~25–55 is fully stocked; ~55–70 is overstocked with competition-driven mortality beginning; above ~70 indicates significant overstocking with elevated stress and wildfire vulnerability.
- Merchantable Timber Volume: Estimated total merchantable biomass of live trees, stored in metric tons per hectare (Mg/ha). This is a single-band composite representing the aggregated allocation of aboveground live tree biomass across sawtimber, pulpwood, sub-merchantable, and non-merchantable categories as defined by the USDA Forest Service FIA program. Individual product categories are not separable in this raster. Estimates refer to standing live biomass only and do not account for defect, tree quality, or standing dead wood.
Explore the full Data Story
To dive deeper into the methods, context, and example applications behind this dataset, explore the full VPDC Data Story that accompanies it.
See the full Data Story ⭢How to get started
This dataset is available in two ways: as CONUS-wide Cloud-Optimized GeoTIFFs (COGs) for full-extent analysis, and as tiled downloads for working with specific regions.
Option 1: CONUS-Wide COG Downloads
For users who need complete national coverage or prefer to work with cloud-native formats, each layer is available as a single CONUS-wide Cloud-Optimized GeoTIFF. COGs support efficient partial reads and streaming access, making them well-suited for cloud-based workflows, large-area analyses, and integration with tools like GDAL, rasterio, and QGIS without downloading the entire file.
- Choose your layer(s): Select the data layer from the download section below.
- Download or stream: Use the direct download link to save the file locally, or reference the HTTPS URL directly in your analysis environment for streaming access.
Option 2: Tile-Based Downloads
For users focused on specific regions, the data is organized into a tiling grid for targeted downloads.
- Explore the map: Zoom and pan to locate your area of interest. The tile grid outlines the spatial boundaries of the dataset.
- Select your tiles: Click one or more tiles to highlight them. Each tile corresponds to a geographic area you can download.
- Review & adjust: Use the checkboxes in the selection list to confirm or deselect tiles.
- Download your data: Click the "Download Data" button to bundle your selected tiles into a single ZIP file .
A few things to keep in mind:
- Download limitations: For best performance, please select no more than 20 tiles per download. Larger selections may slow your browser or cause issues.
- Need more coverage? No problem—just download in smaller batches. All tiles use the same folder structure, so you can easily merge them later in your GIS software for seamless regional analysis.
- Tiling grid: To keep downloads efficient and analysis straightforward, the dataset is organized into a fixed tiling grid. This approach prioritizes optimal file sizes and regional coverage for analytical workflows. While the grid follows standard geospatial conventions, it is not pixel-aligned to USGS ARD or other standardized grids.
Download
CONUS Forest Structure, Density & Products
Wall-to-wall maps of basal area, relative density, and merchantable timber volume across the contiguous United States at 30-meter resolution, produced by Vibrant Planet for American Forests.

Direct Download (Full File) - HTTPS Link
Use this link to download the entire file directly to your local storage through the browser. This method is ideal for quick and easy access but requires sufficient local storage and bandwidth for the full download.
Download data:


Basal Area
Estimated cross-sectional area of all live tree stems (m²/ha) across the contiguous United States. Values are stored directly as square meters per hectare in a single-band, 16-bit integer raster. Basal area is a fundamental measure of stand occupancy used in forest management, wildfire risk assessment, and ecological analysis. This layer also serves as a key input to the relative density and forest products models.
Relative Density
Estimated relative stand density across the contiguous United States, expressed as the current stand density divided by maximum stand density. Pixel values represent stocking as a percentage of biological carrying capacity — a value of 55 indicates 55% of maximum stocking. Values below ~25 indicate understocked conditions; ~25–55 indicates fully stocked; above ~70 indicates significant overstocking with elevated stress and wildfire vulnerability. Non-forest pixels are coded as 0.
Merchantable Timber Volume
Estimated total merchantable biomass (Mg/ha) across the contiguous United States. Represents the aggregated allocation of aboveground live tree biomass into four forest product categories (sawtimber, pulpwood, sub-merchantable, and non-merchantable) as defined by the USDA Forest Service FIA program. Produced by Vibrant Planet's ForestProducts model using gradient boosting regression calibrated against FIA inventory data, with forest structure estimates, forest type group, and ecoregion as inputs. Estimates refer only to standing live biomass.
Heading
Explore scenario data downloads
Use the filters, then click a group to reveal individual downloads.
Download tiled data:
Selected Data Tiles:
Direct Access
Get hands-on access to this dataset using interactive notebooks. Choose between the Google Colab notebook for quick exploration in your browser or access the hosted Jupyter Notebooks via Binder or GitHub for more advanced workflows.

Direct access to the Google Collab notebook
Open and explore instantly
Click the button to the left to launch an interactive notebook directly in your browser. This pre-configured Colab notebook provides a quick and easy way to explore, visualize, and analyze the data—no setup required.
GitHub hosted Jupyter Notebooks
Flexible access for advanced workflows
Access the full collection of Jupyter Notebooks hosted on GitHub. These notebooks can be used on your local machine or via cloud platforms like Binder or Google Colaboratory, providing flexibility for more advanced customizations.
Licensing & Attribution
Licensed under Creative Commons Attribution–NonCommercial–ShareAlike 4.0 International (CC BY-NC-SA 4.0).
You may share and adapt this dataset for noncommercial purposes with attribution under the same license.
Required Attribution:
© 2025 Vibrant Planet. Distributed by Vibrant Planet Data Commons. Licensed under CC BY-NC-SA 4.0. Acknowledgment: The development of these datasets was supported by a grant from the Doris Duke Foundation to American Forests for the development of the Forest Innovation Platform.
For commercial or special-use requests, email us at contact@vpdatacommons.org
Disclaimer
Vibrant Planet provides the information hosted on the Vibrant Planet Data Commons site (www.vpdatacommons.org) (the “Site”) as a PUBLIC SERVICE for NONCOMMERCIAL USES only. The information is provided as-is, as-available, and without warranty of any kind, whether express, implied, or statutory, concerning the accuracy, completeness, reliability, or suitability of the information. Further, we do not warrant that this site will (i) be uninterrupted or error-free; or (ii) result in any desired outcome. We are not responsible for content of other services, data or public information that may be used by or linked to this site. By accessing this website and/or the data contained within, you assume the entire responsibility and liability related to the use of the information it contains, and you release Vibrant Planet Data Commons, Vibrant Planet and all data providers from liability. You may use the Site only for lawful purposes Users also should note that property boundaries included on any map do not represent an on-the-ground survey suitable for legal, engineering, or surveying purposes. They represent only the approximate relative locations. We reserve the right to withdraw or amend this Site, and any service or material we provide on the Site, in our sole discretion without notice. We will not be liable if for any reason all or any part of the Site is unavailable at any time or for any period. From time to time, we may restrict access to some parts of the Site, or the entire Site to users or visitors to the site. The Site and its entire contents, features, and functionality (including but not limited to all information, software, text, displays, images, video, and audio, and the design, selection, and arrangement thereof) are owned by Vibrant Planet Data Commons, its licensors, or other providers of such material and are protected by United States and international copyright, trademark, patent, trade secret, and other intellectual property or proprietary rights laws. This site is operated by Vibrant Planet Data Commons.