

Forest Structure, Density & Timber Data
Three New Data Layers for Understanding Forest Vulnerability Across the Contiguous United States
America's forests are under compounding stress. Hotter droughts are becoming longer and more frequent, fire seasons are lengthening, and insect outbreaks, such as bark beetle, are expanding into regions that historically provided natural buffers. Across the western U.S., the legacies of fire exclusion and past land use have left millions of acres overstocked and vulnerable. While in the east, shifting precipitation and temperature regimes are altering competitive dynamics among tree species in ways that are difficult to see in any single inventory visit. To face these increasingly complex issues, land managers are being asked to make increasingly complex decisions: where to intervene, where to restore, where to protect, and where it may be appropriate to let natural processes play out.
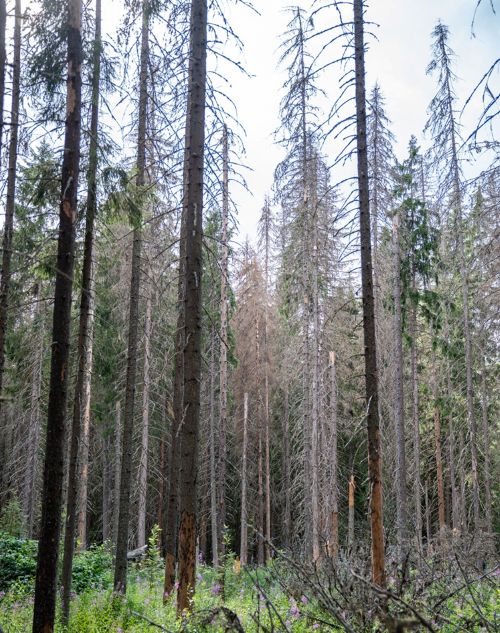
Bark beetle mortality in a coniferous forest. Standing dead trees like these are increasingly common across the western U.S. as warming temperatures expand beetle ranges into previously resistant elevations.
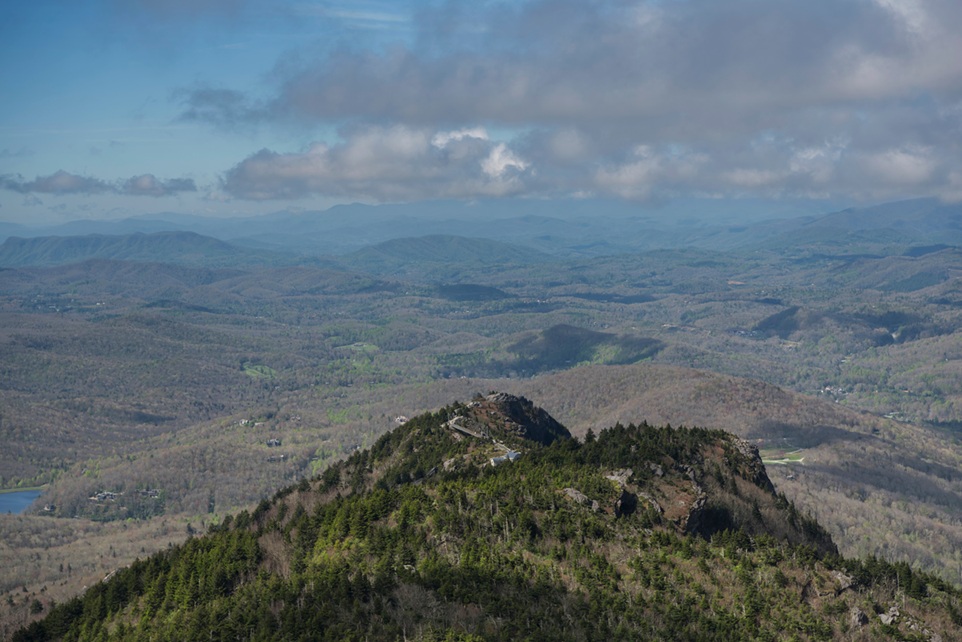
Grandfather Mountain and the Blue Ridge, North Carolina. Eastern forests face subtler but equally consequential shifts in species competition driven by changing precipitation and temperature regimes.
Those decisions hinge on more than inventories that work to account for how many trees exist, or which species dominate a landscape. They require understanding how likely different stressors are to converge, how much difference management interventions could make, and where the timber removed might help sustain the local processing infrastructure that makes restoration economically viable.
Until now, answering those questions at continental scale required stitching together disparate datasets from multiple agencies and vendors, waiting years for data refreshes, or relying on datasets at scales and spatial resolutions poorly suited for the stand and landscape-scale decisions that drive real management outcomes.
The datasets released here were created to help close that gap. Developed by Vibrant Planet scientists through a shared modeling framework and made available here on the Vibrant Planet Data Commons, these layers provide a coherent, wall-to-wall view of forest structure, density, and merchantable material across the contiguous United States. They are designed to support planning at the scale where decisions are made — from individual stands to multi-ownership landscapes — and refreshed annually so the data remains current whenever management plans are revisited.
This release includes three closely related datasets that together offer a new way to reason about forest vulnerability, opportunity, and tradeoffs.
WHAT THE DATA ARE
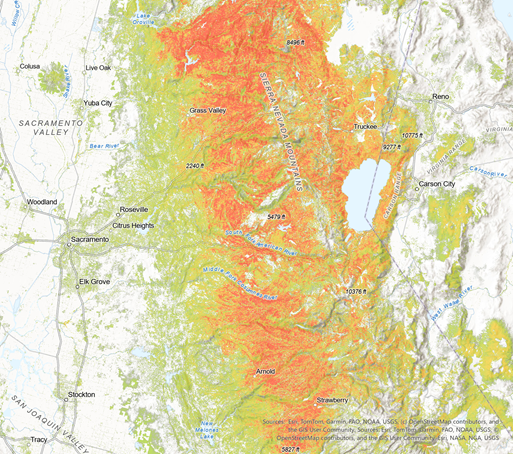
Basal area: Warm colors indicate higher density per hectare. Central Sierra Nevada.
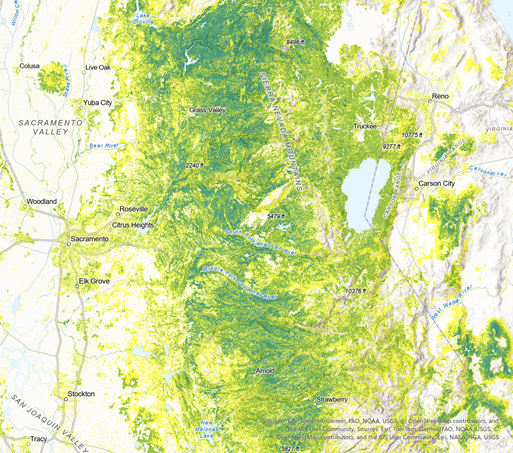
Relative stand density: yellow indicates sparsely stocked, light green fully stocked, dark green heavily stocked. Central Sierra Nevada.
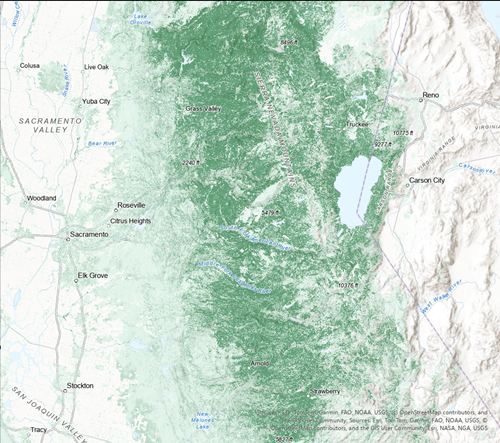
Merchantable timber volume, t/ha: darker green indicates greater volume per hectare; transparent areas carry little or none. Central Sierra Nevada.
Geography & Scope
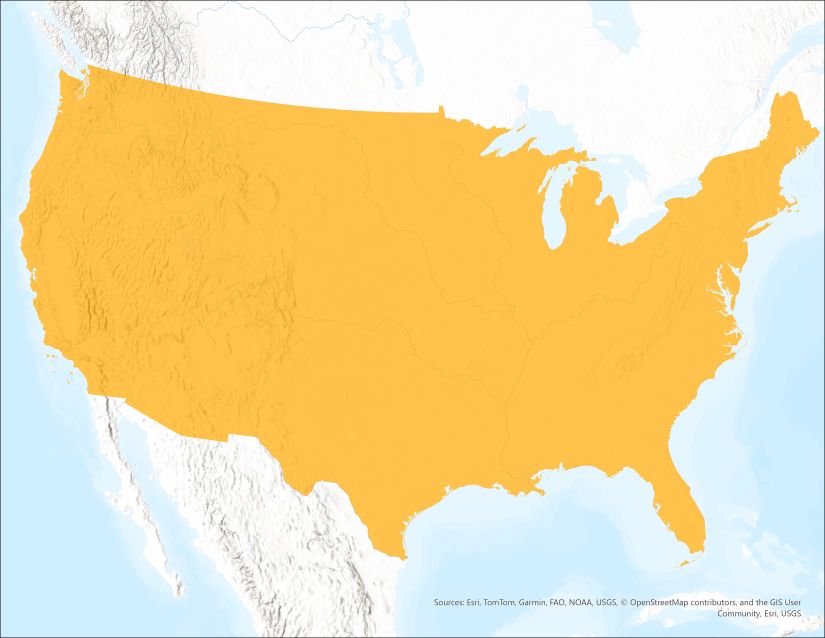
All three layers cover the contiguous United States at 30m resolution. They are derived from 2024 Sentinel-2 satellite imagery (June-August) and projected in NAD83 / CONUS Albers (EPSG:5070). Data are distributed as Cloud-Optimized GeoTIFFs (COGs)—both as tiled collections and full-CONUS mosaics—designed for efficient access in cloud-based analysis and planning environments.
Because the modeling pipeline relies solely on freely available satellite imagery for inference, annual refresh is operationally feasible, enabling these layers to track forest change on a cadence that matches management planning cycles.
These datasets are designed for landscape- and stand-scale planning. They support treatment prioritization, vulnerability assessment, and regional analysis. They are not designed for individual tree detection, precision forestry applications, or post-disturbance salvage planning.
Why This Dataset Matters
From Fragmented Signals to Shared Understanding
The Data Gap
Forest managers have long worked with incomplete information. Plot-based inventories and tabular summaries from the national Forest Inventory and Analysis program are spatially sparse and updated on multi-year cycles. Lidar provides exceptional precision where it exists, but coverage remains patchy and expensive to maintain. Wall-to-wall products from academic groups and federal agencies offer national scope but with irregular update cadence, coarser resolution, and limited ability to capture the local-scale variation that drives stand-level decision-making. Commercial remote sensing products have advanced rapidly in recent years, but are often proprietary, costly to license at scale, or tailored to specific market applications rather than the broad public-interest planning needs that drive climate adaptation and restoration prioritization.

The result: planning happens in patchwork, constrained by what data are available rather than what decisions require.
By providing a consistent, wall-to-wall view of forest structure, stocking pressure, and commercially relevant biomass, this release supports a more integrated understanding of forest condition at the scales where planning actually occurs. Rather than relying on a fragmented mix of plot data, lidar footprints, and jurisdiction-specific metrics, managers can work from a shared baseline that is comparable across ownerships and regions.
Relative Density, in particular, introduces a common interpretive frame for forest vulnerability. Different regions have long relied on different stocking metrics and thresholds, making it difficult to discuss stress, competition, and risk in a consistent way. Expressing density relative to biological capacity allows forests with very different structures to be evaluated using the same conceptual lens—highlighting where competitive stress is likely to increase mortality risk, even when absolute conditions vary.
At the same time, the inclusion of merchantable timber volume allows financial outcomes to be made explicit rather than left implicit. Restoration and fuels treatments do not occur in a vacuum; they are shaped by costs, markets, and processing capacity. Making this information visible alongside ecological indicators enables more transparent planning conversations—where feasibility, trade-offs, and constraints can be discussed openly rather than handled through separate analyses.
Just as importantly, these datasets are designed to be updated annually — a cadence that also more closely reflects how quickly forest conditions are changing. As successive datasets become available, managers will be able to track trends over time, assess whether treatments are achieving their intended outcomes, and identify emerging areas of concern before disturbance occurs.
Taken together, these data do not prescribe where or how to act. Instead, they improve sightlines. They support clearer prioritization, better coordination across ownerships, and more informed discussions about where limited resources can have the greatest impact on forest resilience.
HOW THE DATA WERE CREATED
From satellite imagery to planning-scale datasets
The datasets released here are produced through a multi-stage pipeline designed to generate consistent forest information across large geographies. Each stage performs a distinct role, and its outputs feed forward into the next. This modular structure matters: it allows individual components to be evaluated, improved, or updated over time without rebuilding the entire system, supporting both transparency and long-term maintainability.
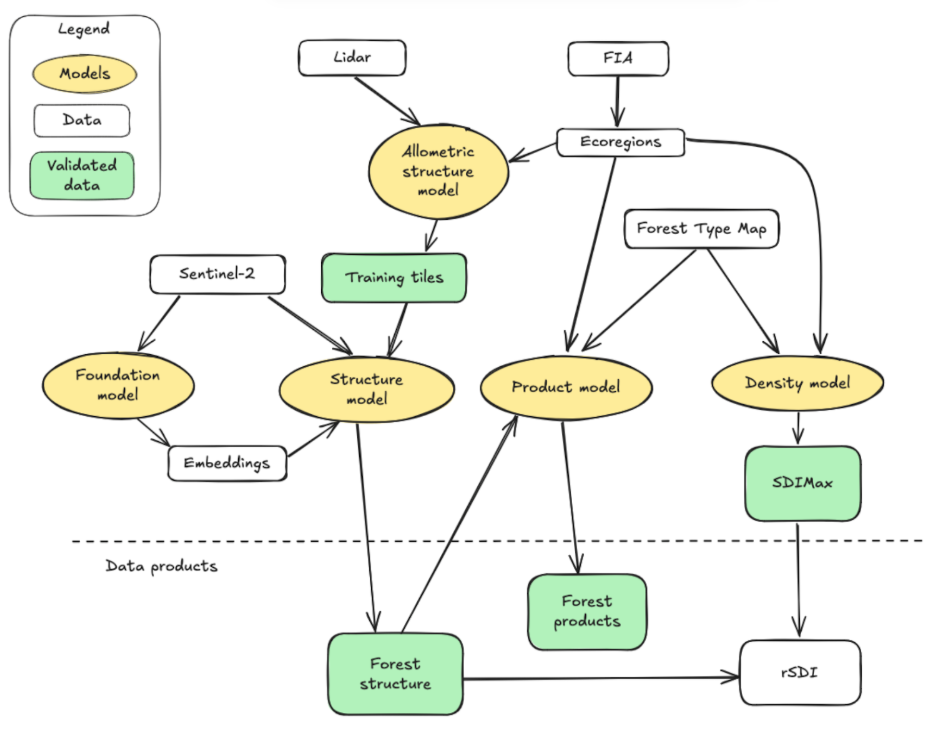
Architecture of the modeling pipeline from source data to delivered products. Yellow nodes are models; gray nodes are data inputs and intermediates; green nodes are the three validated data layers released here. The detailed walkthrough of each stage follows below. Diagram from Zachmann et al., (2025). https://arxiv.org/abs/2606.20291
The pipeline progresses through three stages — the last of which branches into two parallel models:
First, a foundation model learns the visual grammar of landscapes by training on millions of satellite images — not to predict forest attributes directly, but to build a rich internal representation of how landscapes are structured. Think of it as learning to read the landscape before being asked specific questions about it. This is analogous to how large language models learn to understand text by predicting missing words; here, the model learns to reconstruct masked portions of satellite imagery, developing an understanding of spatial patterns from individual tree crowns to stand-scale structure.
Second, a structure model builds on that foundation to predict specific forest attributes — canopy cover, canopy height, basal area, aboveground biomass, and quadratic mean diameter — trained against more than 73,000 lidar-derived reference tiles spanning diverse forest conditions across CONUS. Stand Density Index and trees per hectare are then derived from these predictions. Basal area, the first of the three delivered layers, comes directly from this stage.
Third, two models work in parallel from this structural foundation. A density model estimates each forest's biological carrying capacity — the maximum stocking it can sustain given its composition and regional context — using structure model outputs and National Forest Inventory data through a statistical approach that accounts for how regional factors like climate and genetic populations interact with species physiology and tolerances to shape competitive limits. Dividing current stand density by this ceiling produces Relative Density, the second delivered layer.
Separately, a products model allocates aboveground biomass into timber product categories using forest structure estimates alongside forest type, regional context, and Forest Inventory and Analysis observations. The model produces estimates for four mutually-exclusive product pools — sawtimber, pulpwood, sub-merchantable, and non-merchantable. Sawtimber and pulp are combined into the merchantable timber layer delivered in this release.
A model card providing a more detailed technical summary of these three data layers can be found here: https://github.com/Vibrant-Planet-Open-Science/Model-Cards/blob/VibrantForests-ForestInnovationPlatform-v1.0.0/model_cards/VibrantForests/ForestInnovationPlatform.md
What Makes this Approach Different
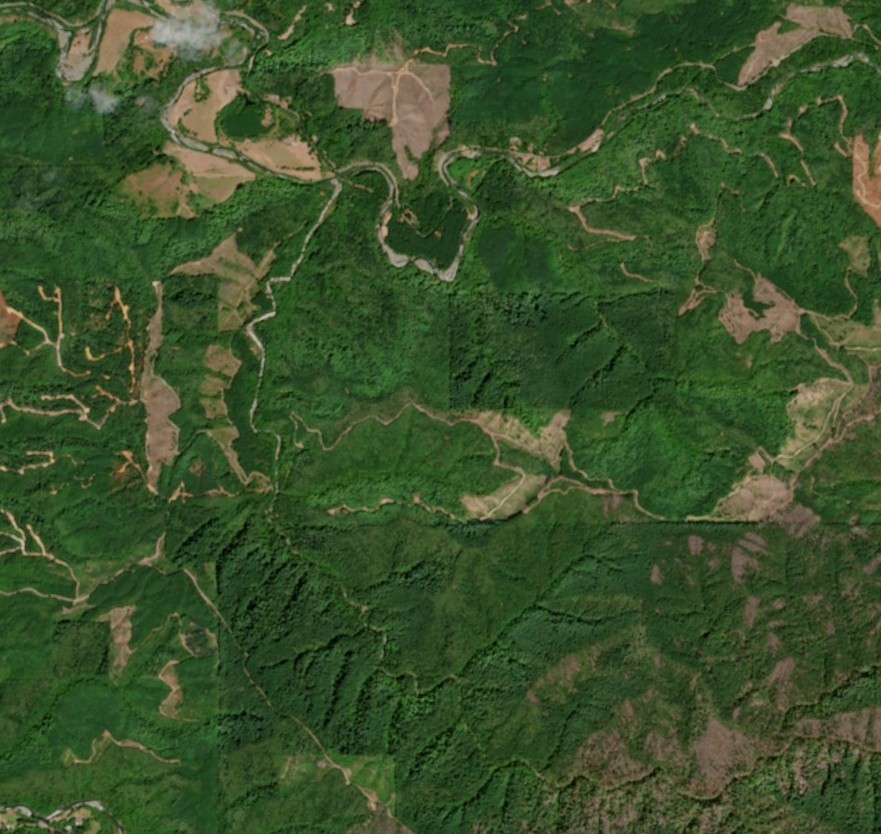
Many existing wall-to-wall forest maps are built from pixel-based models that extract spectral information at sparse plot locations. While useful, these approaches often struggle to capture spatial context — the patterns that distinguish a dense plantation from a structurally complex forest, or a thinned stand from a naturally open woodland.
The foundation model underlying these datasets learns from landscapes, not points. Its training window spans roughly 2.5 kilometers — wide enough to capture relationships between forest patches, edges, clearings, and terrain that pixel-based models miss entirely. The structure model inherits this spatial intelligence and complements it with forest-specific learning, improving its ability to generalize far beyond the specific locations where lidar training data were available.
The practical result is a set of forest structure estimates that are more spatially coherent, less dependent on proximity to training plots, and better suited for the kind of landscape-scale analysis that planning applications demand.
Extracts spectral band values at individual field plot locations. The model sees isolated pixels — no spatial context about surrounding forest structure, edges, or terrain.
- — Training constrained to sparse plot network
- — No spatial context beyond the pixel
- — Precision degrades with distance from training plots
- — Cannot distinguish structurally different forests with similar spectral signatures
A foundation model trains on millions of satellite images, learning spatial patterns — from tree crowns to stand structure — before any forest-specific prediction. The structure model inherits this spatial intelligence.
- — Trained on 73,000+ lidar-derived landscape tiles
- — ~2.5 km context window captures patches, edges, clearings, terrain
- — Generalizes far beyond training locations
- — Distinguishes structurally different forests even with similar spectral profiles
Sentinel-2 true-color imagery, Sixes River area, Rogue River–Siskiyou National Forest, Oregon. Contains modified Copernicus Sentinel data (2025).
Validation and Interpretation
Credibility in forest data depends on testing predictions against observations that were not used in model development, and on doing so at scales relevant to real-world use cases.
The datasets released here were evaluated using independent field inventory observations from BLM, USFS, and Washington DNR, along with regional summaries from the Forest Inventory and Analysis program. These evaluations confirm that the data recover broad patterns in forest structure and stocking across the contiguous United States, while also revealing expected limitations in areas affected by disturbance after reference data were collected and at the upper extremes of observed values.
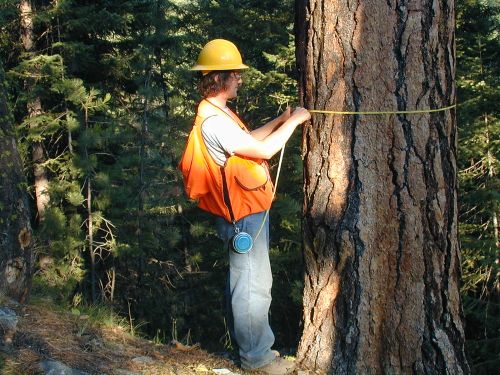
A field crew member measures the diameter of a ponderosa pine during data collection for the Interior West Forest Inventory and Analysis program. These independent field observations are among the data used to evaluate the forest structure estimates released here. Photo by USFS/IWFIA.
Relative Density estimates show strong agreement with independently calculated measures of stocking produced by the FIA program, despite being based on different methodologies. This cross-method consistency supports confidence that the density signal reflects meaningful ecological patterns rather than artifacts of a particular approach.
For merchantable timber, evaluation against FIA observations confirms that the allocation approach captures spatial and regional patterns in commercially relevant live biomass. Performance was strongest for sawtimber and sub-merchantable categories, with greater uncertainty in pulpwood allocation.
Full documentation of model evaluation methods, performance metrics, and known limitations is provided in the linked model cards.
Access Model Cards→ ForestStructure | ForestDensity | ForestProducts | ForestInnovationPlatform
Partner with us
We are actively seeking partners who can contribute to improving these datasets.
If your organization holds field inventory data, lidar acquisitions, or treatment monitoring records that could support independent validation or benchmarking, we welcome that collaboration.
Better data emerge from broader evaluation—and the forest management community’s collective knowledge is the most important input we can receive.
Applications
These datasets are designed to support real-world planning and analysis tasks that require understanding forest condition, vulnerability, and feasibility at scale. Each layer can be used independently—for example, to inform carbon accounting, vulnerability screening, or timber supply assessment. Used together, they enable more integrated planning conversations by allowing forest condition, ecological risk, and economic considerations to be evaluated side by side.
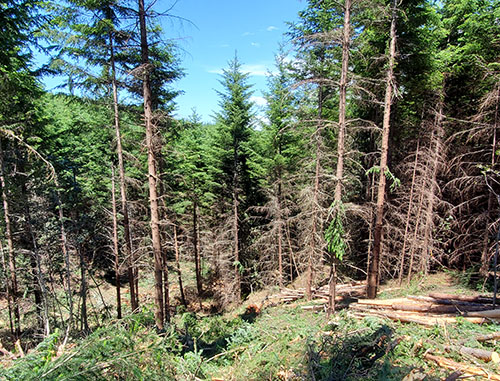
Photo by USFS.
Assess Forest Vulnerability and Resilience
Relative Density helps identify forests approaching their biological limits, where competition-driven stress increases susceptibility to drought, insects, and high-severity fire, and stands where current stocking and structure suggest greater capacity to absorb disturbance. By distinguishing forests under active competitive pressure from those with room to grow, the data support early identification of areas where intervention may reduce the likelihood of avoidable mortality and loss.
Prioritize Treatments and Compare Scenarios
When combined with fire hazard, community exposure, habitat priorities, or other landscape-scale datasets, Relative Density can help identify convergence zones—places where thinning or density management advances multiple objectives at once. A consistent structural and density baseline allows managers to compare alternative treatment scenarios and evaluate how different interventions address the conditions driving risk.
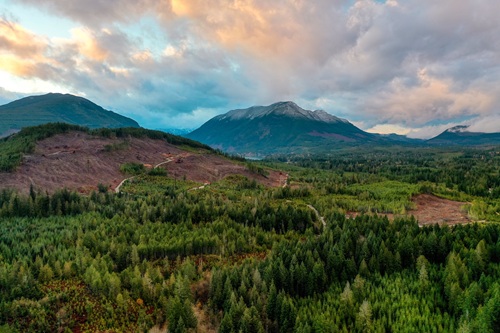
Photo by Adobe Stock.
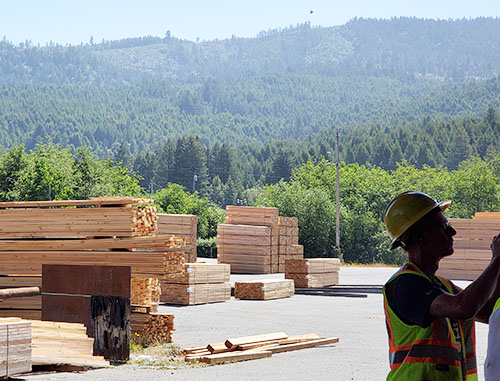
Photo by USFS.
Match Restoration Needs to Market Capacity
Overlaying merchantable timber volumes with sawmill locations, woodsheds, and processing infrastructure enables a clearer view of where restoration treatments are both ecologically beneficial and economically feasible. Just as importantly, it highlights where infrastructure gaps constrain the pace of work, helping planners distinguish between ecological need and practical limitation when sequencing projects.
Monitor Change Over Time
As annual updates become available, these datasets can be used to track where forest density is increasing toward stress thresholds before widespread mortality occurs. They also support post-treatment evaluation—helping assess whether interventions achieved intended density reductions and establishing baselines against which future change can be measured.
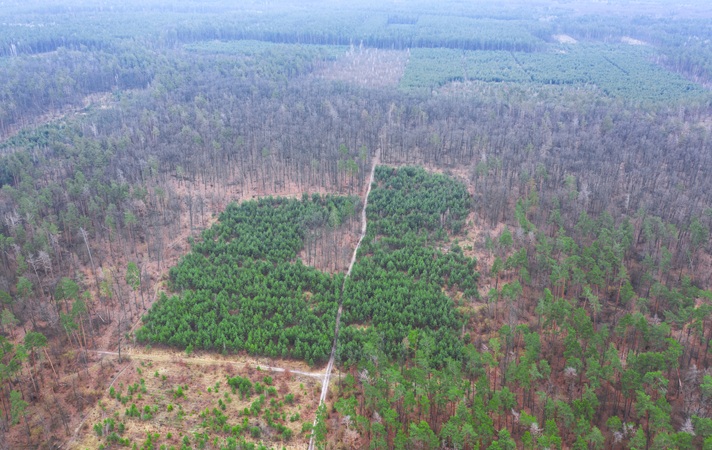
Photo by USFS.
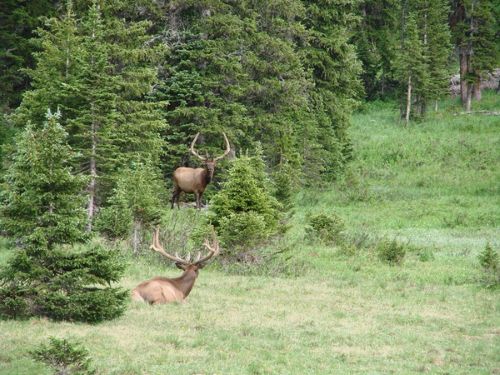
Photo by USFS.
Bring Ecological Limits into Planning Conversations
Relative Density provides a shared language for discussing “how full is too full” across regions, forest types, and management traditions. It connects ecological limits directly to silvicultural decision-making in terms that foresters, ecologists, and planners across ownership and jurisdictional boundaries can all use.
APPLIED USE CASE: AMERICAN FORESTS’ FOREST INNOVATION PLATFORM
These three layers are among the datasets integrated into American Forests' Forest Innovation Platform (FIP), which provides expert-curated forestry data and climate projections to help users understand forest conditions and vulnerabilities across the continental United States in their Forest Assessment Tool. Funding for these data was provided by the Doris Duke Foundation and USDA Forest Service as cooperating partners and funders.
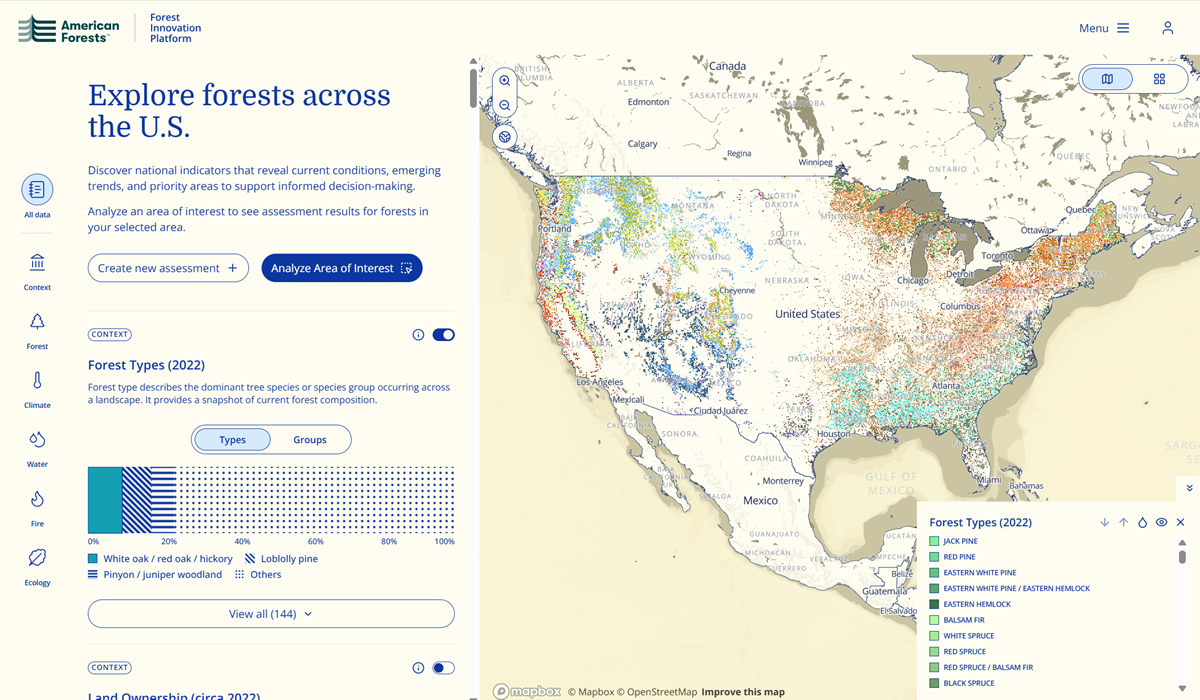
The Forest Innovation Platform brings forestry data and climate projections together in a national forest assessment tool, where users can explore conditions, vulnerabilities, and other indicators for an area of interest. Explore the the tool: https://forestinnovationplatform.org/assessment-tool
looking ahead
These three layers are part of a broader effort to increase transparency and strengthen the scientific foundation for forest management decisions at scale. The same data that inform wildfire risk models and treatment prioritization on the Vibrant Planet Platform are being made openly available through the Vibrant Planet Data Commons and incorporated into the Forest Innovation Platform.
Keeping these data current, expanding their validation, and improving their usefulness across diverse landscapes will require continued investment and collaboration. With support from funders, data partners, and the broader forest management community, future releases can incorporate new imagery and field observations, strengthen regional evaluation and refinement, and deepen integration with planning and decision-support tools.
Better decisions require better sight lines. These datasets are part of a growing foundation of consistent, updatable, wall-to-wall forest data supporting tools like the Forest Innovation Platform and Vibrant Planet Platform, and the evidence-based, landscape-scale planning that climate adaptation demands.
Help shape what comes next
Interested in using these data, contributing to their continued development, or supporting future releases? We’d love to hear from you.
References
1. Reineke, L. H. (1933). “Perfecting a Stand Density Index for Even-Aged Forests.” Journal of Agricultural Research 46, no. 7: 627–38. https://www.fs.usda.gov/psw/publications/cfres/cfres_1933_reineke001.pdf.
2. Weiskittel, A.,, et al. , (2009). “Sources of Variation in the Self-Thinning Boundary Line for Three Species with Varying Levels of Shade Tolerance.” Forest Science 55 (): 84–93. https://research.fs.usda.gov/treesearch/34585.
3. Drew, T.J. & Flewelling, J.W. (1979). Stand density management: an alternative approach and its application to Douglas-fir plantations. Forest Science 25(3): 518-532. https://doi.org/10.1093/forestscience/25.3.518
4. Duncanson, L. et al. (2025).. Spatial resolution for forest carbon maps. Science 387(6732): 370-371. https://research.fs.usda.gov/download/treesearch/80807.pdf
5. Dinerstein, E. et al. (2017). An ecoregion-based approach to protecting half the terrestrial realm. BioScience 67(6): 534-545. https://academic.oup.com/bioscience/article/67/6/534/3102935
6. Ray, D., et al. (2023). “Relative Density as a Standardizing Metric for the Development of Size-Density Management Charts.” Journal of Forestry 121(5–6): 443–56. https://doi.org/10.1093/jofore/fvad029.
7. Zukswert, J., and L. Kenefic. (2025). “Stand Density Management Charts for Eastern Spruce-Fir Forests.” Rooted in Research: 46. Madison, WI: U.S. Department of Agriculture, Forest Service, Northern Research Station. 2 p. https://research.fs.usda.gov/treesearch/68854.