California Structure Graph Data
A statewide, building-level network dataset that captures how structures across California are spatially connected to one another. The dataset represents the built environment as a graph, enabling analysis of structure-to-structure exposure pathways relevant to wildfire and community risk assessment.

About this dataset
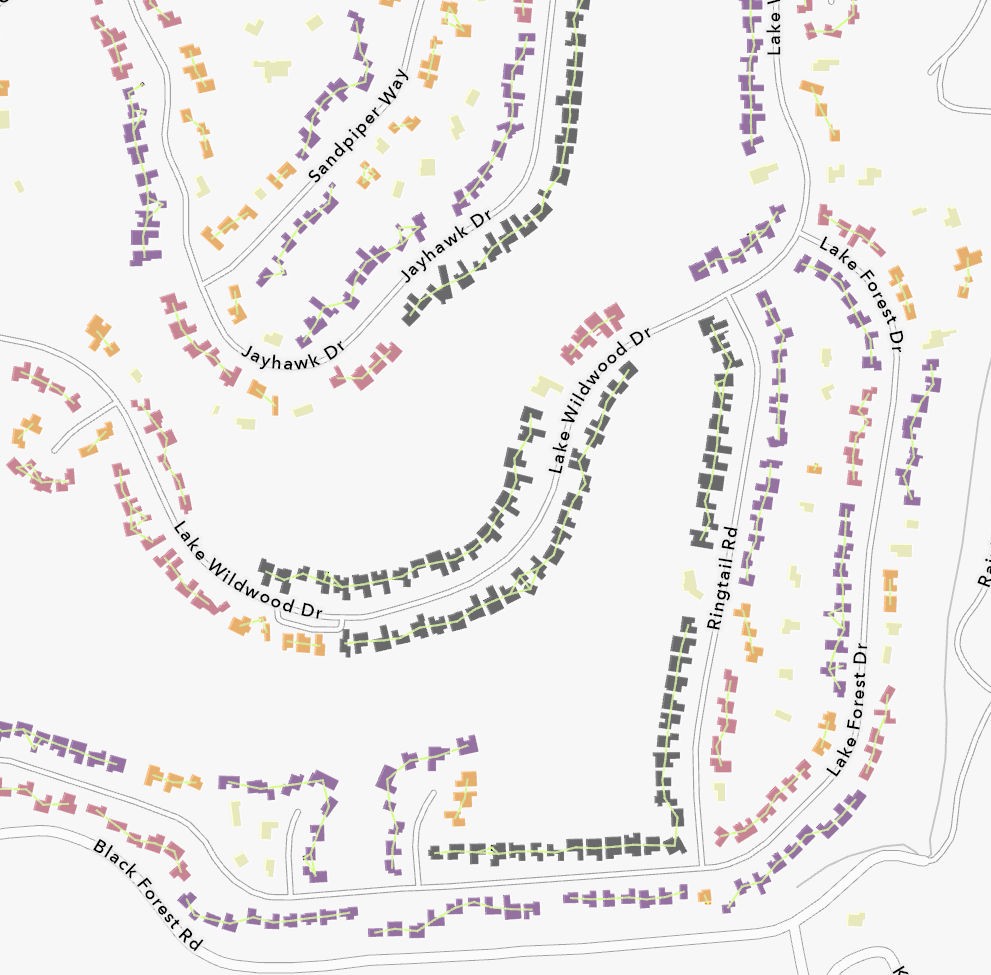
The California Structure Graph is a statewide, building-level network describing how mapped structures in California relate spatially to one another based on structure separation distance (SSD). Each structure is represented as a node, and connections between structures are represented as edges when buildings fall within a specified distance of one another.
This graph-based representation supports analysis of potential structure-to-structure exposure pathways, including direct flame and radiant heat transfer, short-range ember exposure, and broader neighborhood-scale connectivity. Connectivity metrics derived from the network help characterize how community layout, density, and spacing may influence how fire spreads within the built environment once it arrives.
Edges are provided for all structure pairs within 100 meters, with exact boundary-to-boundary SSD values recorded. To support flexible analysis, edges are distributed across distance-based bins spanning the full 0–100 m range, allowing users to examine connectivity at distances relevant to different exposure mechanisms.
Structure Separation Distance (SSD) is measured as the minimum boundary-to-boundary distance between full building footprints sourced from the Overture Maps Foundation. Using full polygons, rather than centroids, allows distances to reflect the actual physical gaps fire would need to cross between structures. Neighboring structures within 100 meters were identified using a distributed spatial processing workflow.
Important limitations: This dataset describes exposure pathways, not structural vulnerability or fire probability. It does not include defensible space, vegetation, building materials, slope, wind, or other vulnerability factors. Connectivity metrics quantify spatial proximity and potential exposure and should be used alongside—rather than in place of—parcel-level or site-specific risk assessments.
What’s included in this dataset
How to interpret this layer
Structure Graph Nodes (Buildings)
A statewide polygon data layer representing individual mapped structures across California. Each record corresponds to a single structure and includes summary connectivity metrics derived from nearby structures within 100 meters.
Included attributes:
- Unique structure identifier
- Degree (number of connected neighboring structures)
- Clustering coefficient (local neighborhood connectivity)
- Mean structure separation distance (mean SSD to connected neighbors)
- Minimum structure separation distance (nearest neighbor SSD)
These metrics describe how each structure is positioned within its local built-environment network.
Structure Graph Edges (Structure Pairs)
A set of distance-binned tables representing connections between pairs of structures within 100 meters of one another. Each record describes a spatial relationship between two structures.
Included attributes:
- Source structure ID
- Target structure ID
- Structure separation distance (SSD), measured boundary-to-boundary
- Line geometry connecting structure centroids (for visualization and spatial analysis)
Edges are distributed across distance-based bins spanning the full 0–100 m range, enabling flexible filtering and analysis of structure-to-structure exposure at user-defined distances.
Formats
- File formats: Parquet (analytics-ready) and GeoPackage (GIS-ready)
Explore the full Data Story
To dive deeper into the methods, context, and example applications behind this dataset, explore the full VPDC Data Story that accompanies it.
See the full Data Story ⭢How to get started
Download
California Structure Graph Data
A statewide, building-level network dataset that captures how structures across California are spatially connected to one another. The dataset represents the built environment as a graph, enabling analysis of structure-to-structure exposure pathways relevant to wildfire and community risk assessment.
Direct Download (Full File) - HTTPS Link
Use this link to download the entire file directly to your local storage through the browser. This method is ideal for quick and easy access but requires sufficient local storage and bandwidth for the full download.
Download data:


Structure graph nodes (buildings)
Structure graph nodes representing individual building footprints across California. Each node includes summary connectivity metrics derived from structure-to-structure relationships within 10 m, 50 m, and 100 m distance thresholds, including node degree, clustering coefficient, and distance statistics (mean and minimum structure separation distance). These metrics describe built-environment connectivity and local spatial context and are not predictions of fire behavior, damage, or loss.
Structure graph edges (0-10 m)
Edges (structure pairs) with boundary-to-boundary structure separation distance between 0 and 10 meters. Includes source and target structure identifiers, exact structure separation distance (SSD), and centroid-connection line geometry provided as WKT for visualization and spatial analysis. Vector network data represent structure-to-structure relationships within the built environment.
Structure graph edges (10-50 m)
Edges (structure pairs) with boundary-to-boundary structure separation distance between 10 and 50 meters. Includes source and target structure identifiers, exact structure separation distance (SSD), and centroid-connection line geometry provided as WKT for visualization and spatial analysis. Vector network data represent structure-to-structure relationships within the built environment.
Structure graph edges (50-60 m)
Edges (structure pairs) with boundary-to-boundary structure separation distance between 50 and 60 meters. Includes source and target structure identifiers, exact structure separation distance (SSD), and centroid-connection line geometry provided as WKT for visualization and spatial analysis. Vector network data represent structure-to-structure relationships within the built environment.
Structure graph edges (60-70 m)
Edges (structure pairs) with boundary-to-boundary structure separation distance between 60 and 70 meters. Includes source and target structure identifiers, exact structure separation distance (SSD), and centroid-connection line geometry provided as WKT for visualization and spatial analysis. Vector network data represent structure-to-structure relationships within the built environment.
Structure graph edges (80-90 m)
Edges (structure pairs) with boundary-to-boundary structure separation distance between 80 and 90 meters. Includes source and target structure identifiers, exact structure separation distance (SSD), and centroid-connection line geometry provided as WKT for visualization and spatial analysis. Vector network data represent structure-to-structure relationships within the built environment.
Structure graph edges (90-95 m)
Edges (structure pairs) with boundary-to-boundary structure separation distance between 90 and 95 meters. Includes source and target structure identifiers, exact structure separation distance (SSD), and centroid-connection line geometry provided as WKT for visualization and spatial analysis. Vector network data represent structure-to-structure relationships within the built environment.
Structure graph edges (95-100 m)
Edges (structure pairs) with boundary-to-boundary structure separation distance between 95 and 100 meters. Includes source and target structure identifiers, exact structure separation distance (SSD), and centroid-connection line geometry provided as WKT for visualization and spatial analysis. Vector network data represent structure-to-structure relationships within the built environment.
Heading
Explore scenario data downloads
Use the filters, then click a group to reveal individual downloads.
Download tiled data:
Selected Data Tiles:
Direct Access
Get hands-on access to this dataset using interactive notebooks. Choose between the Google Colab notebook for quick exploration in your browser or access the hosted Jupyter Notebooks via Binder or GitHub for more advanced workflows.

Direct access to the Google Collab notebook
Open and explore instantly
Click the button to the left to launch an interactive notebook directly in your browser. This pre-configured Colab notebook provides a quick and easy way to explore, visualize, and analyze the data—no setup required.
GitHub hosted Jupyter Notebooks
Flexible access for advanced workflows
Access the full collection of Jupyter Notebooks hosted on GitHub. These notebooks can be used on your local machine or via cloud platforms like Binder or Google Colaboratory, providing flexibility for more advanced customizations.
Licensing & Attribution
Licensed under Creative Commons Attribution–NonCommercial–ShareAlike 4.0 International (CC BY-NC-SA 4.0).
You may share and adapt this dataset for noncommercial purposes with attribution under the same license.
Required Attribution:
© 2025 Vibrant Planet. Distributed by Vibrant Planet Data Commons. Licensed under CC BY-NC-SA 4.0.
For commercial or special-use requests, email us at contact@vpdatacommons.org
Disclaimer
Vibrant Planet provides the information hosted on the Vibrant Planet Data Commons site (www.vpdatacommons.org) (the “Site”) as a PUBLIC SERVICE for NONCOMMERCIAL USES only. The information is provided as-is, as-available, and without warranty of any kind, whether express, implied, or statutory, concerning the accuracy, completeness, reliability, or suitability of the information. Further, we do not warrant that this site will (i) be uninterrupted or error-free; or (ii) result in any desired outcome. We are not responsible for content of other services, data or public information that may be used by or linked to this site. By accessing this website and/or the data contained within, you assume the entire responsibility and liability related to the use of the information it contains, and you release Vibrant Planet Data Commons, Vibrant Planet and all data providers from liability. You may use the Site only for lawful purposes Users also should note that property boundaries included on any map do not represent an on-the-ground survey suitable for legal, engineering, or surveying purposes. They represent only the approximate relative locations. We reserve the right to withdraw or amend this Site, and any service or material we provide on the Site, in our sole discretion without notice. We will not be liable if for any reason all or any part of the Site is unavailable at any time or for any period. From time to time, we may restrict access to some parts of the Site, or the entire Site to users or visitors to the site. The Site and its entire contents, features, and functionality (including but not limited to all information, software, text, displays, images, video, and audio, and the design, selection, and arrangement thereof) are owned by Vibrant Planet Data Commons, its licensors, or other providers of such material and are protected by United States and international copyright, trademark, patent, trade secret, and other intellectual property or proprietary rights laws. This site is operated by Vibrant Planet Data Commons.